Fig. 2
Download original image
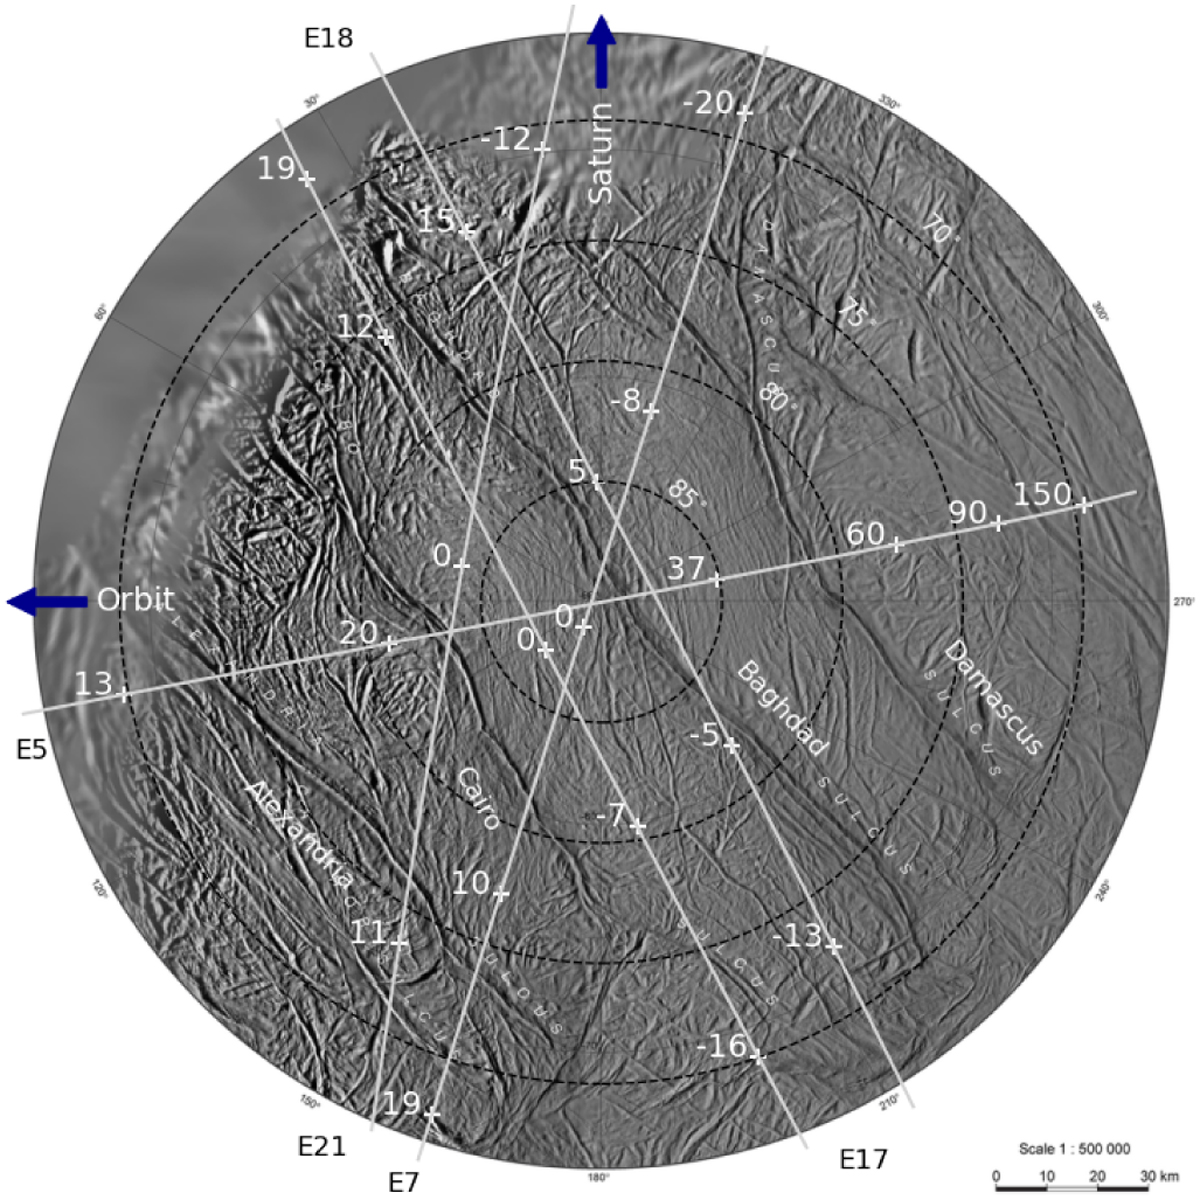
Ground tracks of the Cassini flybys over the SPT of Enceladus. E5, E17, and E18 (shown in red) are flybys for which compositional spectra were obtained. From flybys E7 and E21 (shown in black), we used profiles of particle count rates to constrain our model. Cross symbols mark times measured from the respective closest approach of the spacecraft to Enceladus.
Current usage metrics show cumulative count of Article Views (full-text article views including HTML views, PDF and ePub downloads, according to the available data) and Abstracts Views on Vision4Press platform.
Data correspond to usage on the plateform after 2015. The current usage metrics is available 48-96 hours after online publication and is updated daily on week days.
Initial download of the metrics may take a while.