Open Access
Fig. 19
Download original image
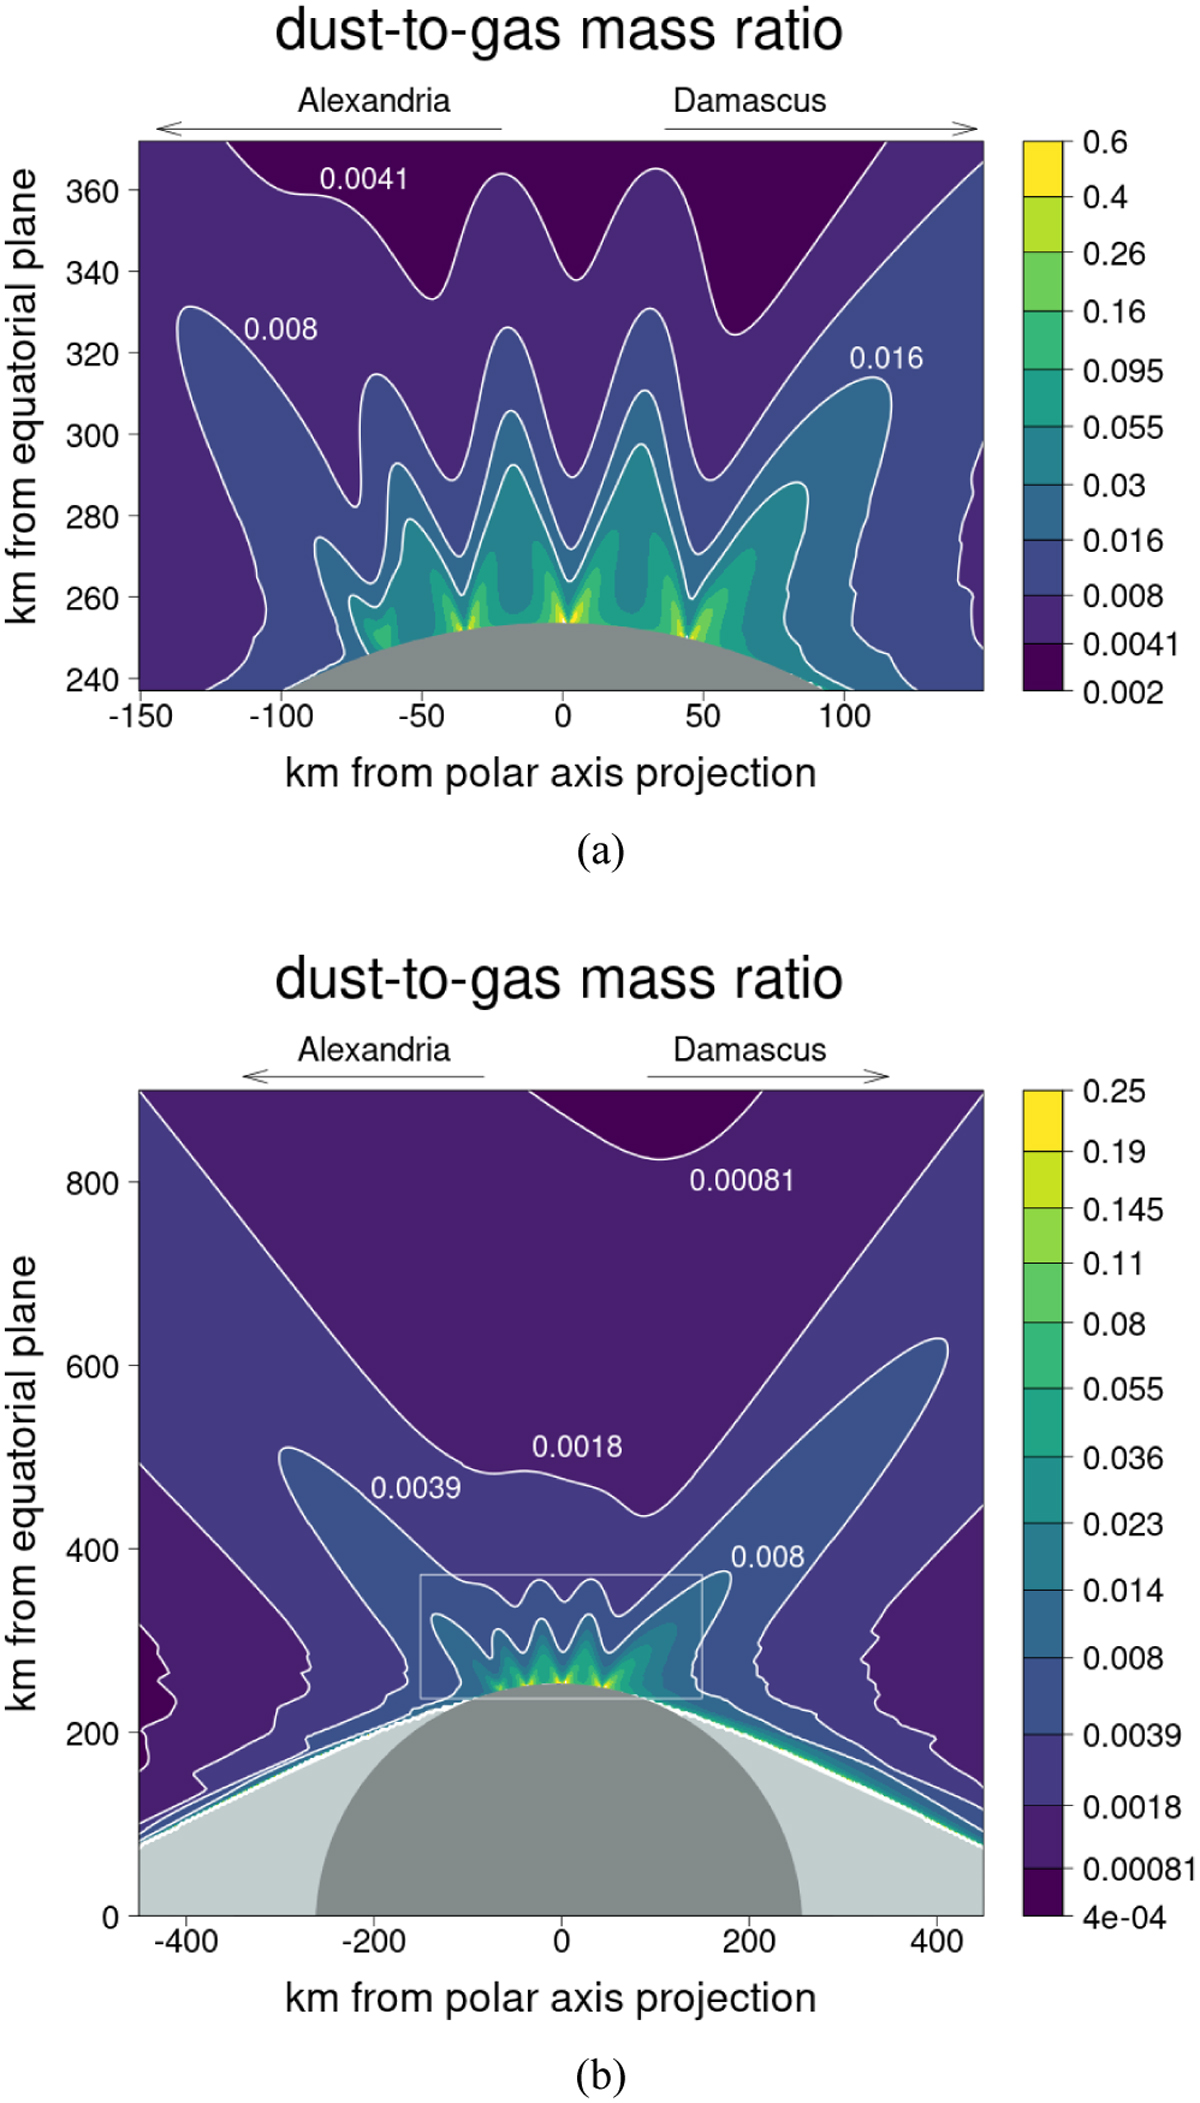
Dust-to-gas mass ratio distribution in the plane along the dashed line in Fig. 16 and the center of Enceladus. The light gray area depicts the region that the freshly ejected gas does not reach. The rectangle in panel b marks the region shown in panel a.
Current usage metrics show cumulative count of Article Views (full-text article views including HTML views, PDF and ePub downloads, according to the available data) and Abstracts Views on Vision4Press platform.
Data correspond to usage on the plateform after 2015. The current usage metrics is available 48-96 hours after online publication and is updated daily on week days.
Initial download of the metrics may take a while.