Fig. 17
Download original image
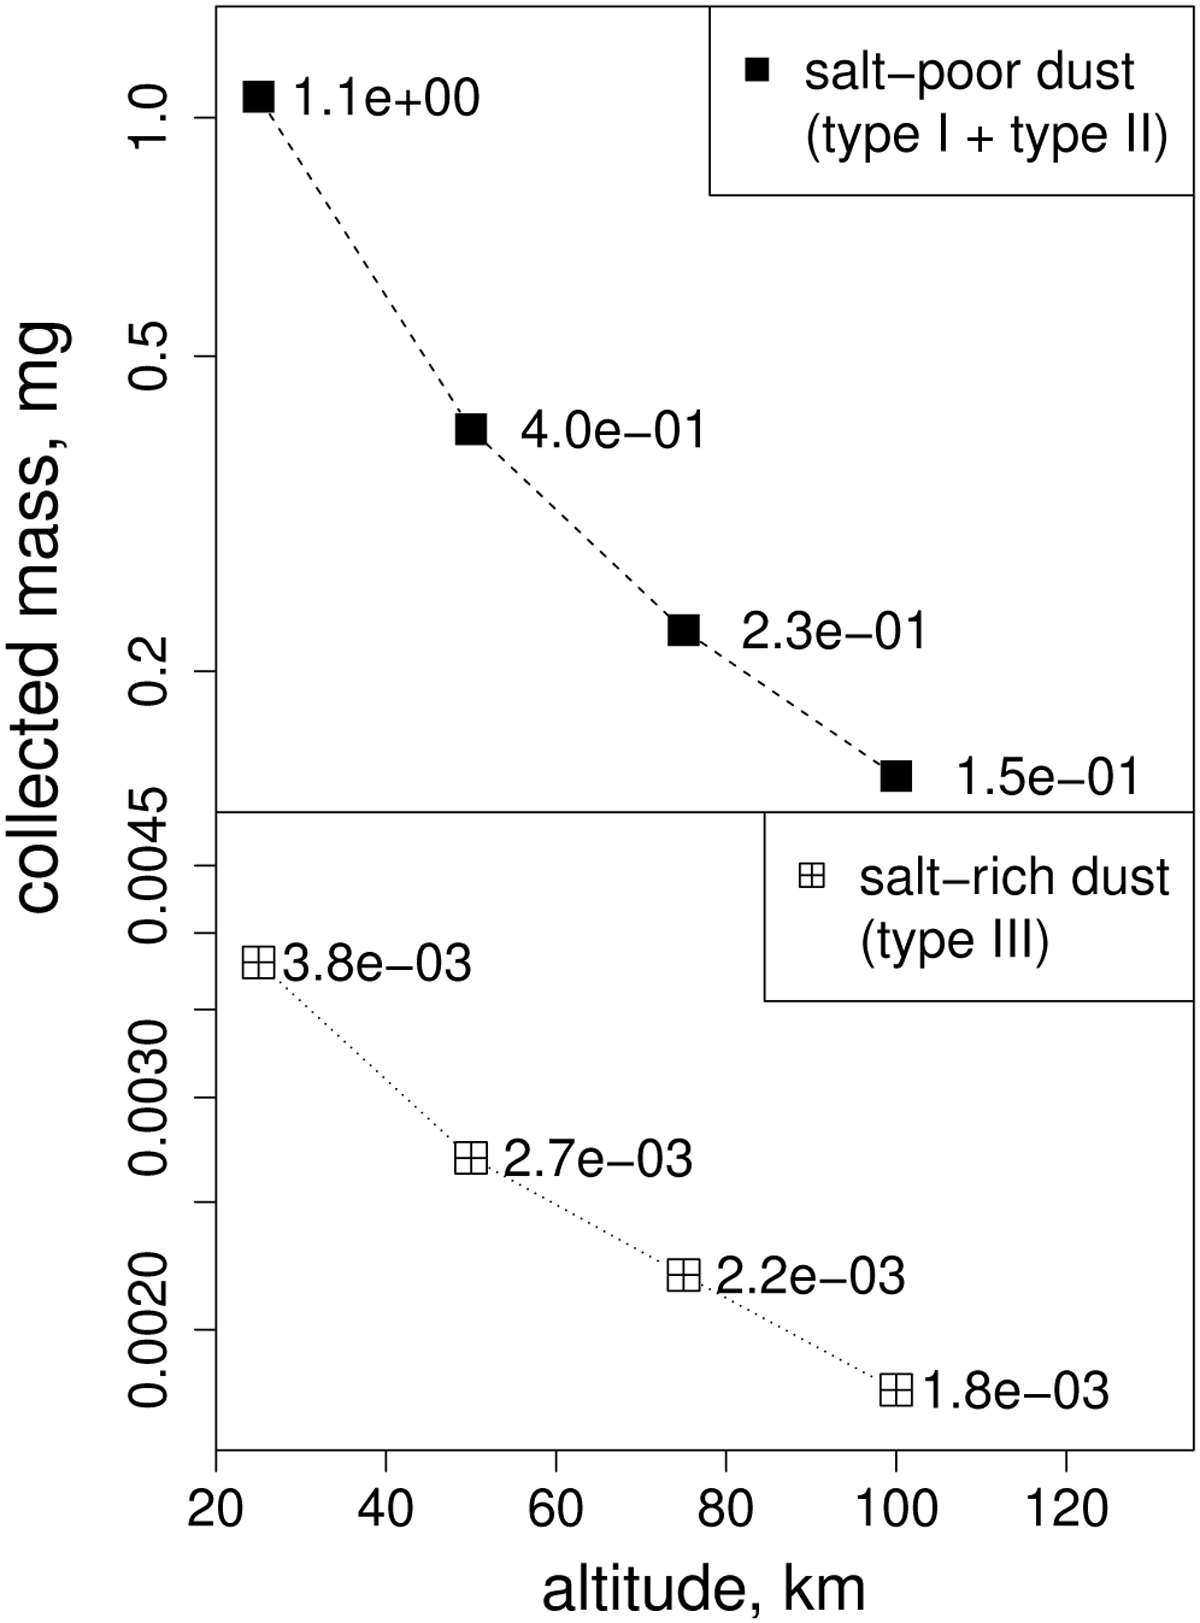
Prediction of our model for the total mass of salt-rich and salt-poor dust collected during hypothetical horizontal flybys (performed along the dashed lines shown in Fig. 16). The mass is calculated for an ideal plane detector of 1 m2 area. Masses for types I and II are added together, giving the salt-poor dust mass. All salt-poor dust particles contain organic compounds, although the actual proportion of mass-spectra showing lines of organics (which classifies them as type II) may depend on the instrument characteristics and flyby velocity.
Current usage metrics show cumulative count of Article Views (full-text article views including HTML views, PDF and ePub downloads, according to the available data) and Abstracts Views on Vision4Press platform.
Data correspond to usage on the plateform after 2015. The current usage metrics is available 48-96 hours after online publication and is updated daily on week days.
Initial download of the metrics may take a while.