Open Access
Fig. 1
Download original image
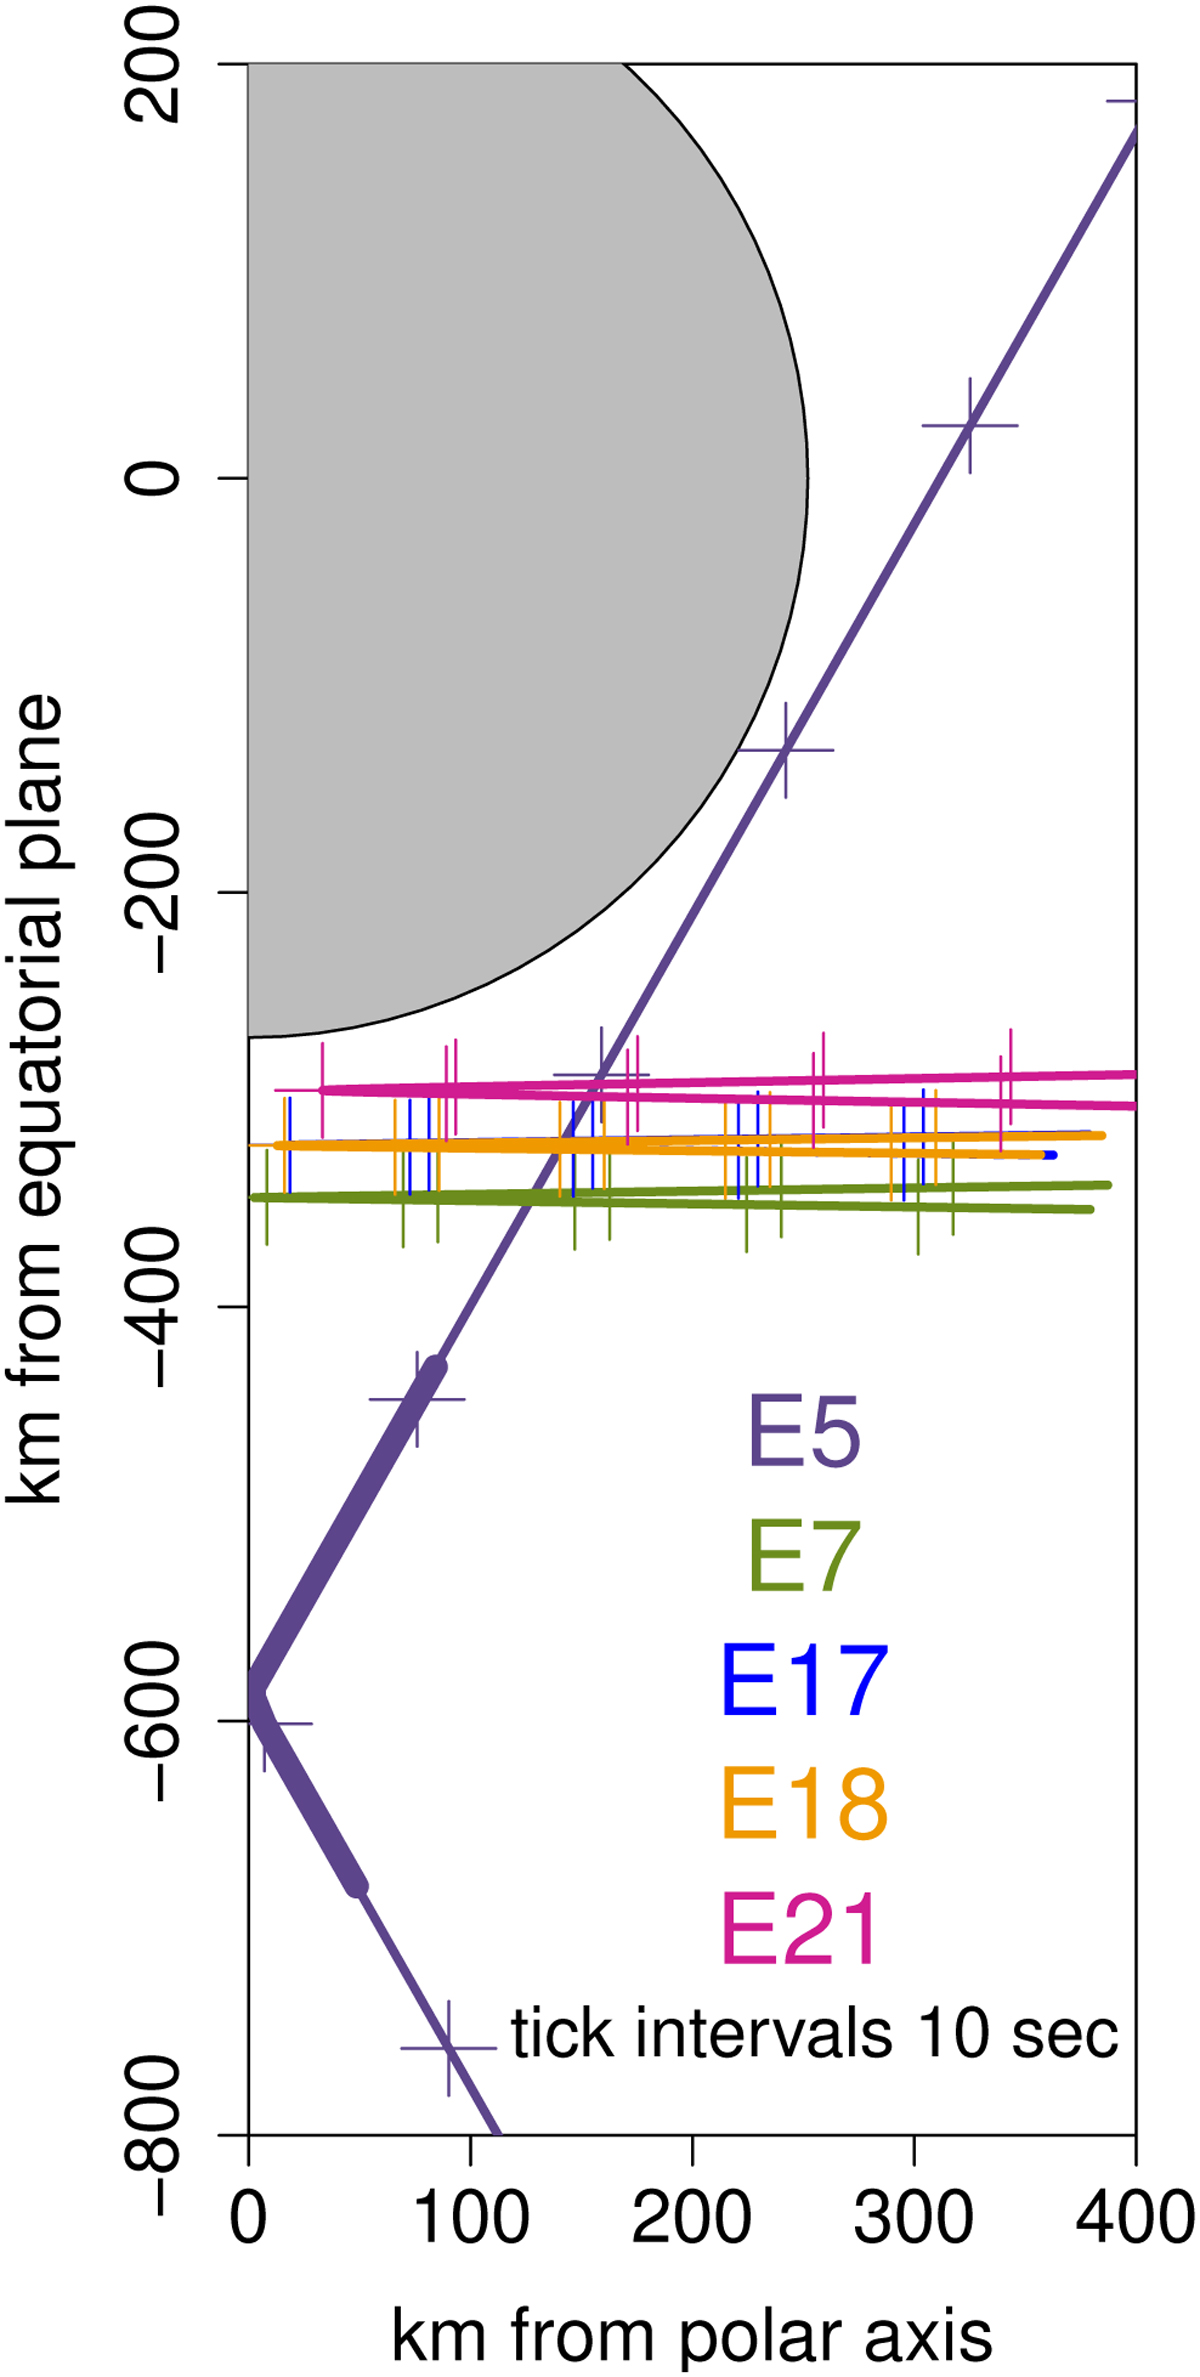
Trajectories of the Cassini flybys at Enceladus studied in this paper. The thick line denotes the part of the E5 trajectory where Cassini was passing through the densest part of the plume and the CDA instrument was saturated and no meaningful data was obtained. The E17 line is hidden under the E18 line.
Current usage metrics show cumulative count of Article Views (full-text article views including HTML views, PDF and ePub downloads, according to the available data) and Abstracts Views on Vision4Press platform.
Data correspond to usage on the plateform after 2015. The current usage metrics is available 48-96 hours after online publication and is updated daily on week days.
Initial download of the metrics may take a while.