Fig. 7.
Download original image
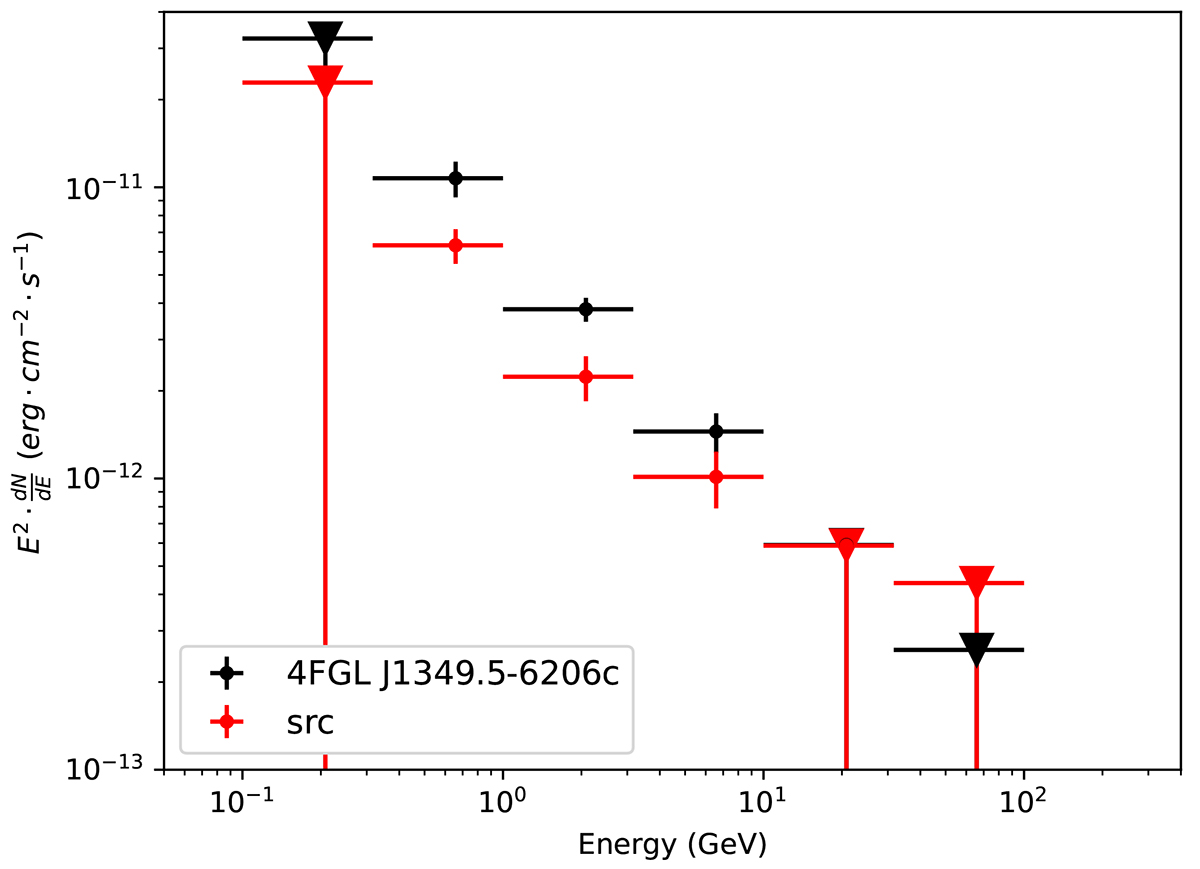
4FGL J1349.5−6206c and src Fermi-LAT SED in the 0.1–100 GeV energy range. Black dots correspond to the Fermi-LAT spectrum of the 4FGL J1349.5−6206c γ-ray source. Red dots represent the Fermi-LAT spectrum of the src (spatially coincident source to the SNR G309.8+00.0) γ-ray source. As expected from the obtained TS maps of Fig. 5, the γ-ray emission of the 4FGL J1349.5−6206c γ-ray source is dominated by the src component at higher energies.
Current usage metrics show cumulative count of Article Views (full-text article views including HTML views, PDF and ePub downloads, according to the available data) and Abstracts Views on Vision4Press platform.
Data correspond to usage on the plateform after 2015. The current usage metrics is available 48-96 hours after online publication and is updated daily on week days.
Initial download of the metrics may take a while.