Fig. 5.
Download original image
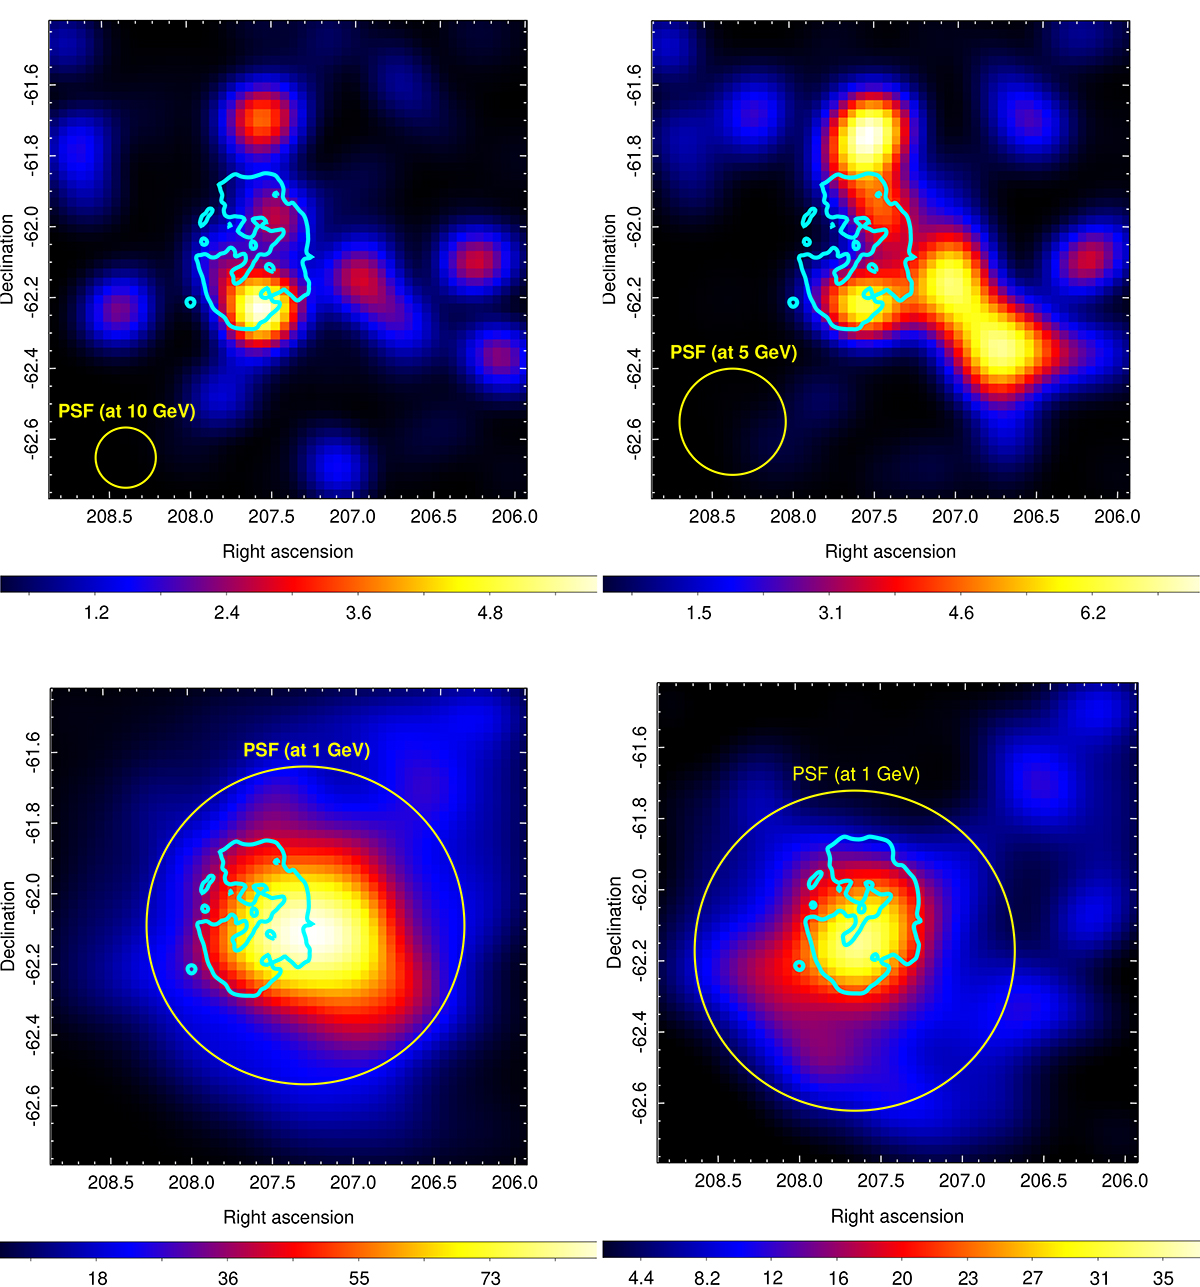
![]() Fermi-LAT TS maps from the location of the SNR G309.8+00.0 at different energy ranges. All sky maps, of 90″ pixel size, centered at the best-fit coordinates of the 4FGL J1349.5−6206c source have been smoothed with a 2.5σ Gaussian kernel. Upper left panel: Fermi-LAT TS map above 10 GeV. Upper right panel: Fermi-LAT TS map above 5 GeV. Lower left panel: Fermi-LAT TS map above 1 GeV. Lower right panel: Fermi-LAT TS map above 1 GeV when modeling the src-north, src-west, and src-northwest components of the 4FGL J1349.5−6206c source. The cyan contour marks the SNR G309.8+00.0 extension as seen in SUMSS 843 MHz radio data. The yellow circle represents the 68% containment size of the PSF at the energy threshold of each sky map, with no smoothing applied.
Fermi-LAT TS maps from the location of the SNR G309.8+00.0 at different energy ranges. All sky maps, of 90″ pixel size, centered at the best-fit coordinates of the 4FGL J1349.5−6206c source have been smoothed with a 2.5σ Gaussian kernel. Upper left panel: Fermi-LAT TS map above 10 GeV. Upper right panel: Fermi-LAT TS map above 5 GeV. Lower left panel: Fermi-LAT TS map above 1 GeV. Lower right panel: Fermi-LAT TS map above 1 GeV when modeling the src-north, src-west, and src-northwest components of the 4FGL J1349.5−6206c source. The cyan contour marks the SNR G309.8+00.0 extension as seen in SUMSS 843 MHz radio data. The yellow circle represents the 68% containment size of the PSF at the energy threshold of each sky map, with no smoothing applied.
Current usage metrics show cumulative count of Article Views (full-text article views including HTML views, PDF and ePub downloads, according to the available data) and Abstracts Views on Vision4Press platform.
Data correspond to usage on the plateform after 2015. The current usage metrics is available 48-96 hours after online publication and is updated daily on week days.
Initial download of the metrics may take a while.