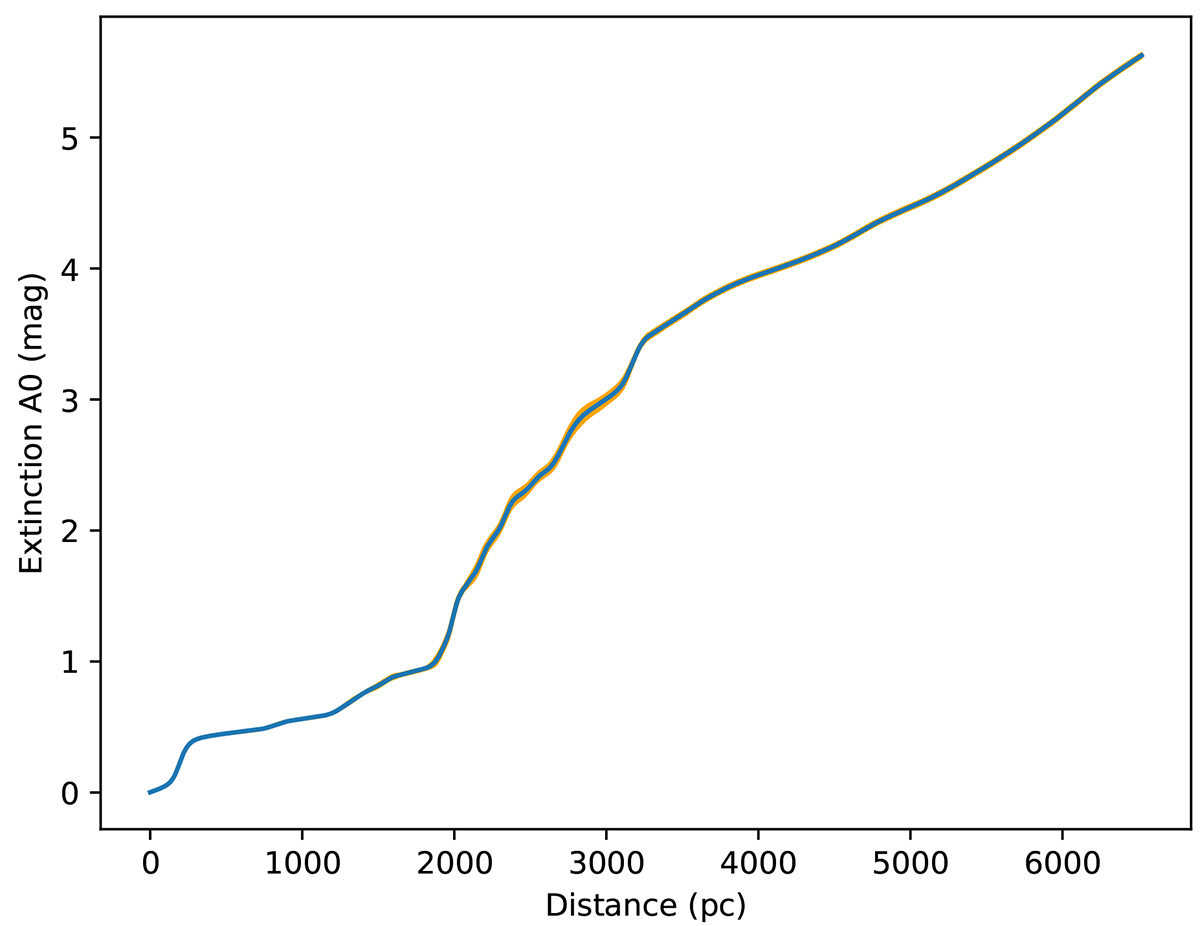
Fig. 4.
Download original image
One-dimensional cumulative extinction as a function of the distance in the direction of the SNR G309.8+00.0. The graph was created by using the EXPLORE G-Tomo app https://explore-platform.eu/ which provides updated extinction data sets extended up to ∼6 kpc by using GAIA eDR3 and 2MASS data (Lallement et al. 2022). The orange range indicates the area of uncertainty where significant uncertainty exists.
Current usage metrics show cumulative count of Article Views (full-text article views including HTML views, PDF and ePub downloads, according to the available data) and Abstracts Views on Vision4Press platform.
Data correspond to usage on the plateform after 2015. The current usage metrics is available 48-96 hours after online publication and is updated daily on week days.
Initial download of the metrics may take a while.