Fig. 3.
Download original image
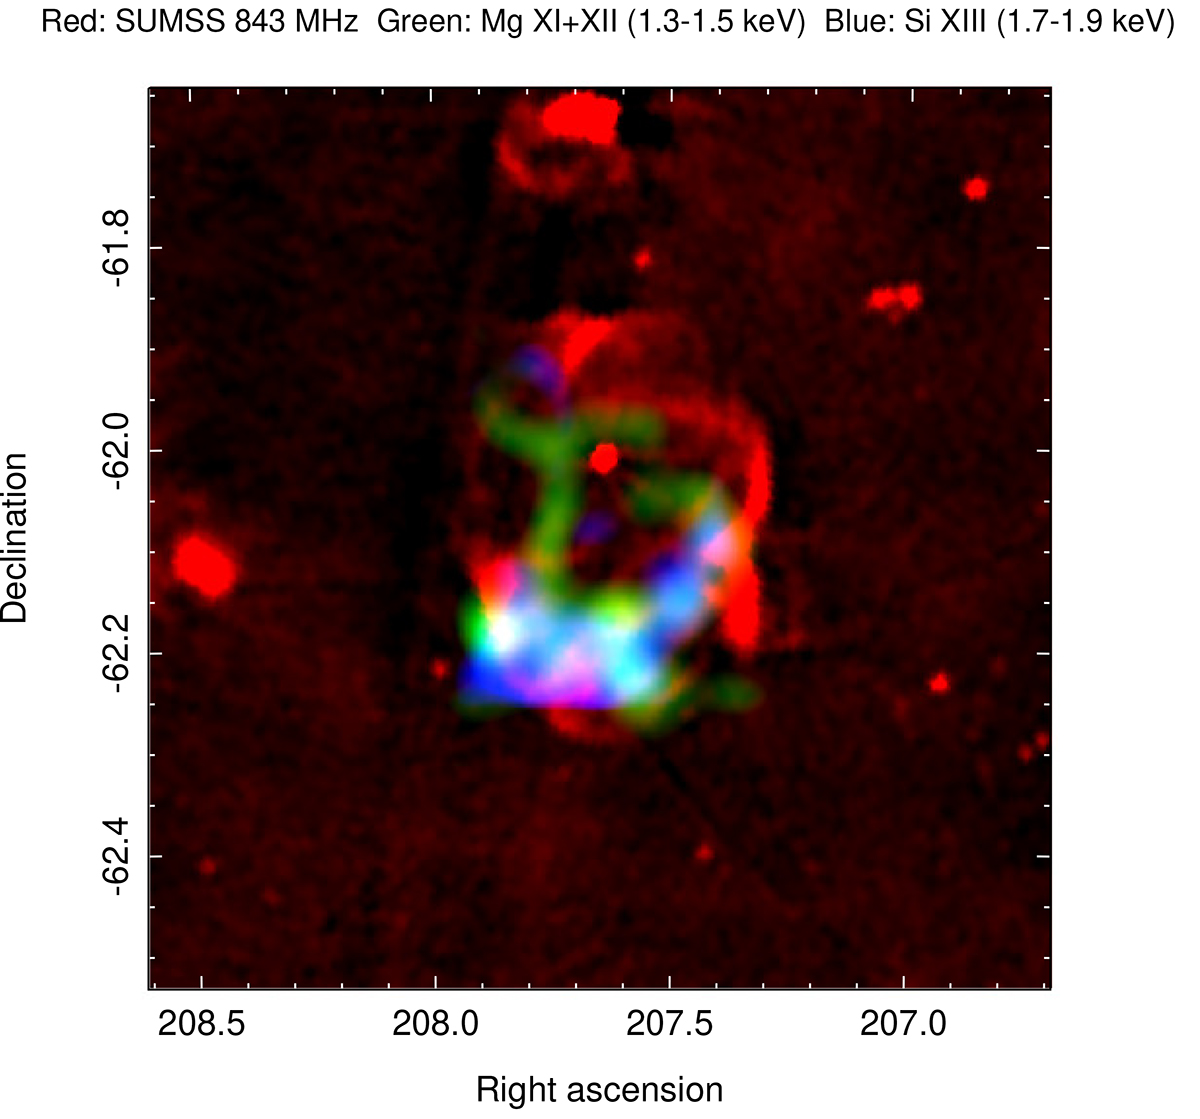
Combined SUMSS at 843 MHz (red), 1.3–1.5 keV eRASS:4 (green), and 1.7–1.9 keV eRASS:4 (blue) image at and around the SNR G309.8+00.0 location. A spectrally motivated selection of X-ray narrow energy ranges was made to demonstrate the spatial distribution of Mg XI+XII and Si XIII emission lines across the remnant’s area. A linear color distribution is used for all three image components. The radio and X-ray components of this sky map were constructed using an identical approach in terms of pixel size, smoothing, and point source removal as described in the caption of Fig. 1.
Current usage metrics show cumulative count of Article Views (full-text article views including HTML views, PDF and ePub downloads, according to the available data) and Abstracts Views on Vision4Press platform.
Data correspond to usage on the plateform after 2015. The current usage metrics is available 48-96 hours after online publication and is updated daily on week days.
Initial download of the metrics may take a while.