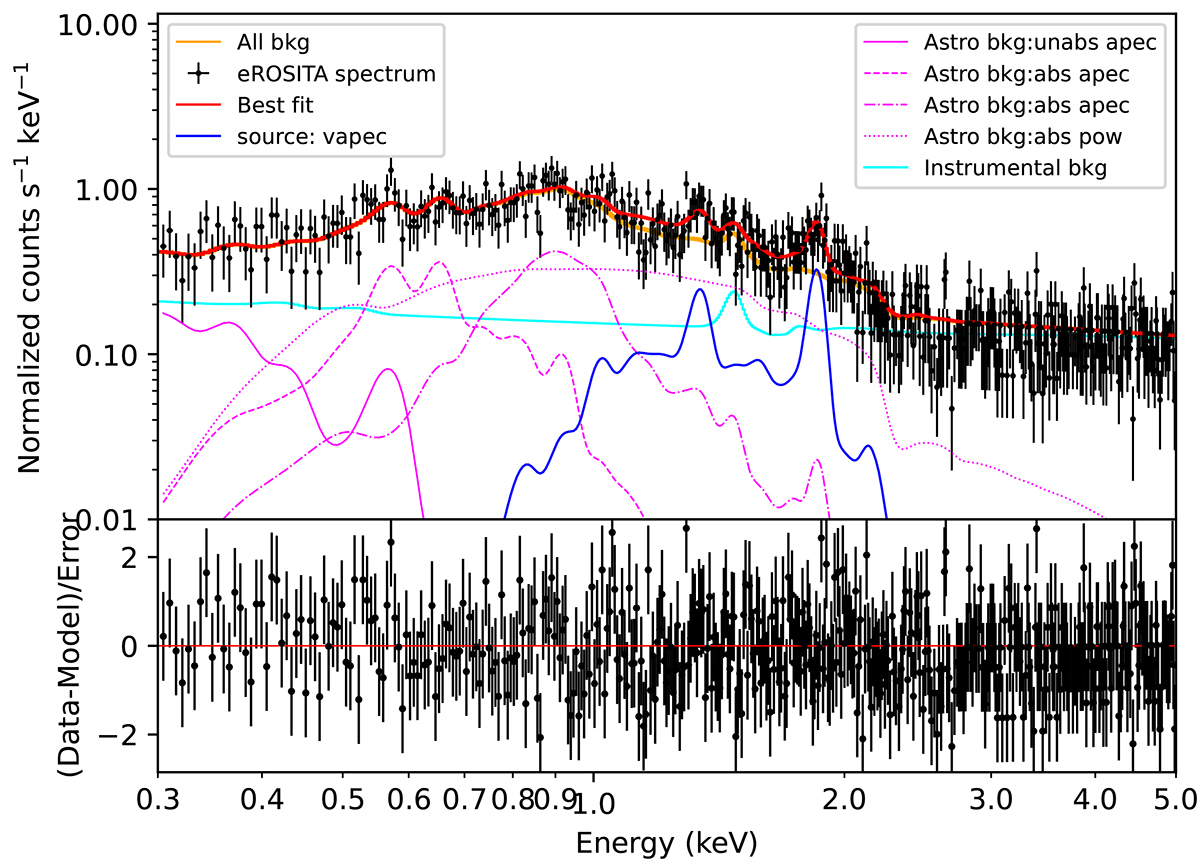
Fig. 2.

Download original image
Energy spectrum in the 0.3–5.0 keV energy band obtained from the selected on-source region as defined in the text (Sect. 3), using eRASS:4 data obtained from TM1,2,3,4, and 6. Following the fitting procedure, a rebinning process that combines two spectral bins into one was used solely for visual purposes. The G309.8+00.0 X-ray energy spectrum is best described by a thermal plasma component in equilibrium (tbabs × vapec) indicated with the blue solid line. All components contributing to the total emission are displayed in detail. The orange line stands for the sum of all background components, that is, instrumental (cyan color), and astrophysical (magenta color), detected at and around G309.8+00.0, revealing the overall contribution of the source to the total spectrum.
Current usage metrics show cumulative count of Article Views (full-text article views including HTML views, PDF and ePub downloads, according to the available data) and Abstracts Views on Vision4Press platform.
Data correspond to usage on the plateform after 2015. The current usage metrics is available 48-96 hours after online publication and is updated daily on week days.
Initial download of the metrics may take a while.


