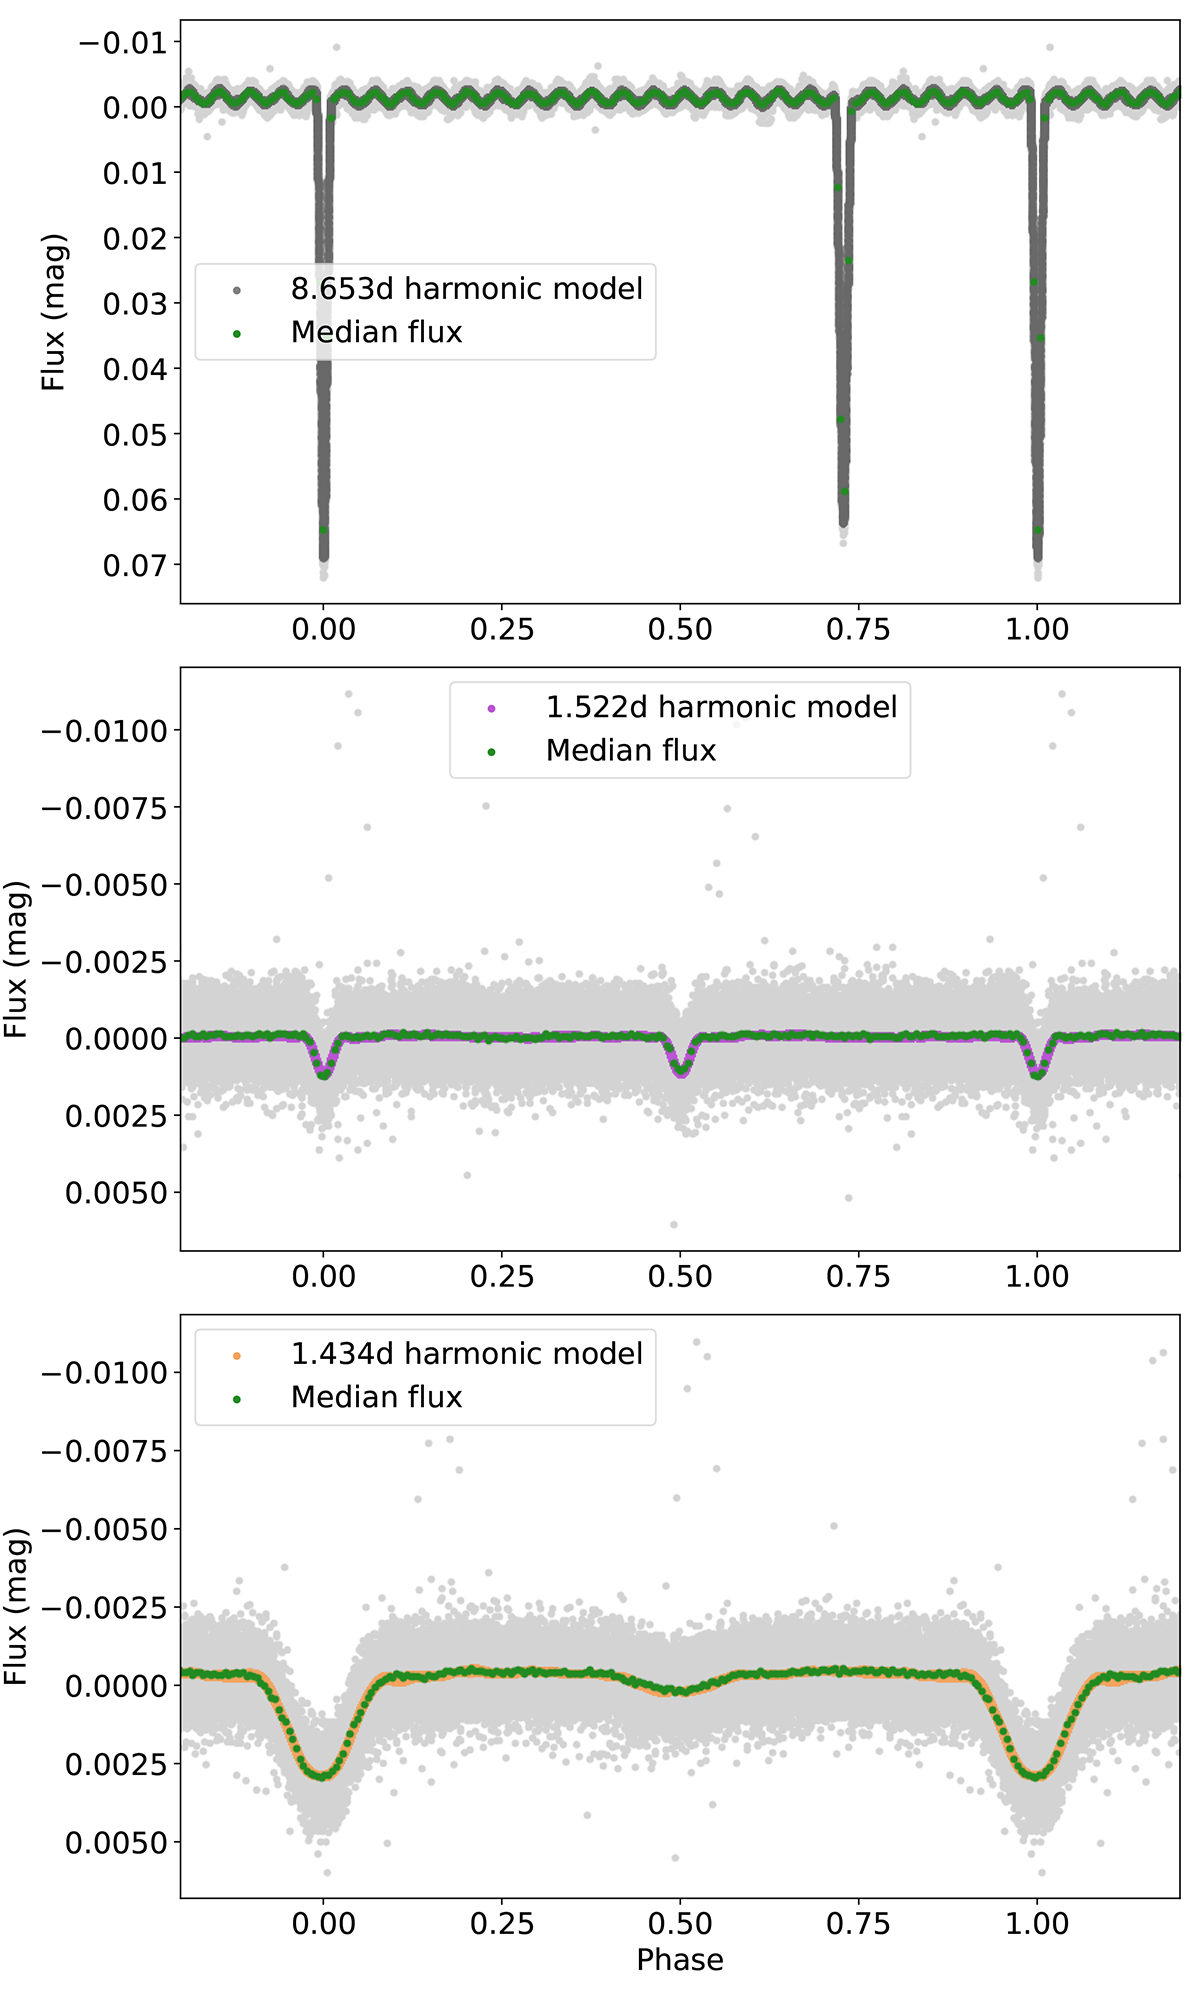
Fig. 3.
Download original image
Phase-folded light curves for each of the eclipsing components and its sinusoid model. The light curve (grey) for each is the residual between the normalised, detrended light curve and every frequency except those forming the sinusoid model. See the main text for a discussion of the high frequency oscillatory signal present in the 8.65d model and the apparent discrepancy with Hełminiak et al. (2017) in the lower two panels.
Current usage metrics show cumulative count of Article Views (full-text article views including HTML views, PDF and ePub downloads, according to the available data) and Abstracts Views on Vision4Press platform.
Data correspond to usage on the plateform after 2015. The current usage metrics is available 48-96 hours after online publication and is updated daily on week days.
Initial download of the metrics may take a while.