Open Access
Fig. 3.
Download original image
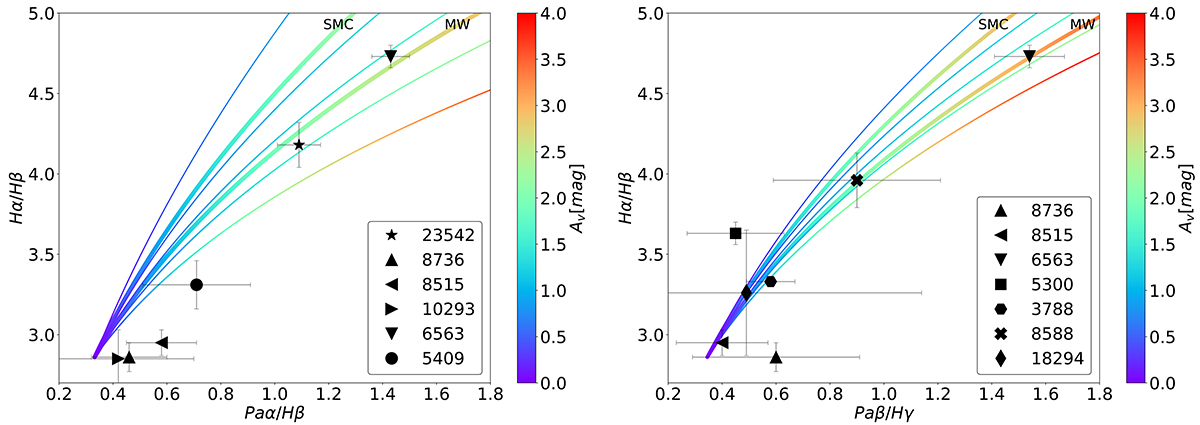
Observed fluxes ratios corrected for underlying stellar absorption. The thin coloured curves are power laws following the CF00 framework with varying exponents, from top to bottom: −2.0, −1.3, −1.0, −0.7, −0.4.
Current usage metrics show cumulative count of Article Views (full-text article views including HTML views, PDF and ePub downloads, according to the available data) and Abstracts Views on Vision4Press platform.
Data correspond to usage on the plateform after 2015. The current usage metrics is available 48-96 hours after online publication and is updated daily on week days.
Initial download of the metrics may take a while.