Fig. 11.
Download original image
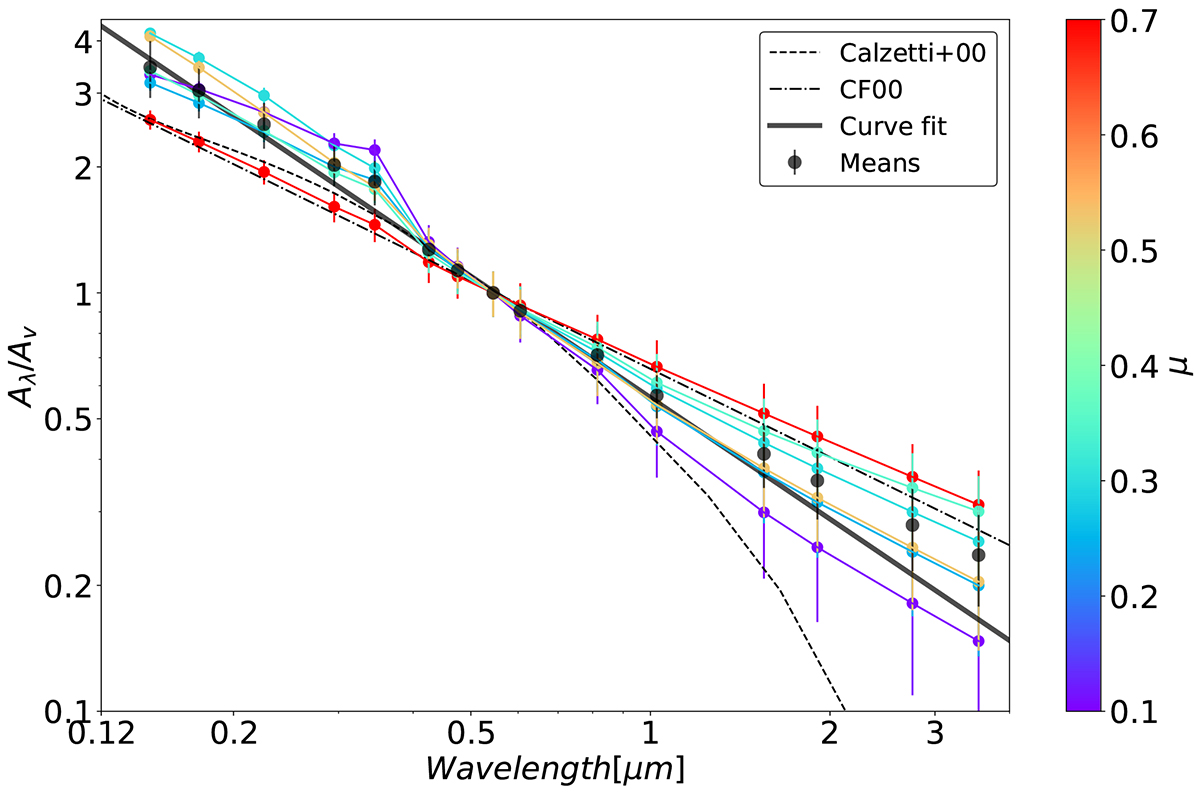
Total attenuation curves of the subsample with a fit of the mean curve in a black solid line. On the rightmost measurement from top to bottom: IDs 8588, 8710, 5409, 23542, 6563 and 5430. The classical CF00 recipe as well as the Calzetti law have been added for comparison. Each total attenuation curve is color-coded with its value of μ presented in Table 6.
Current usage metrics show cumulative count of Article Views (full-text article views including HTML views, PDF and ePub downloads, according to the available data) and Abstracts Views on Vision4Press platform.
Data correspond to usage on the plateform after 2015. The current usage metrics is available 48-96 hours after online publication and is updated daily on week days.
Initial download of the metrics may take a while.