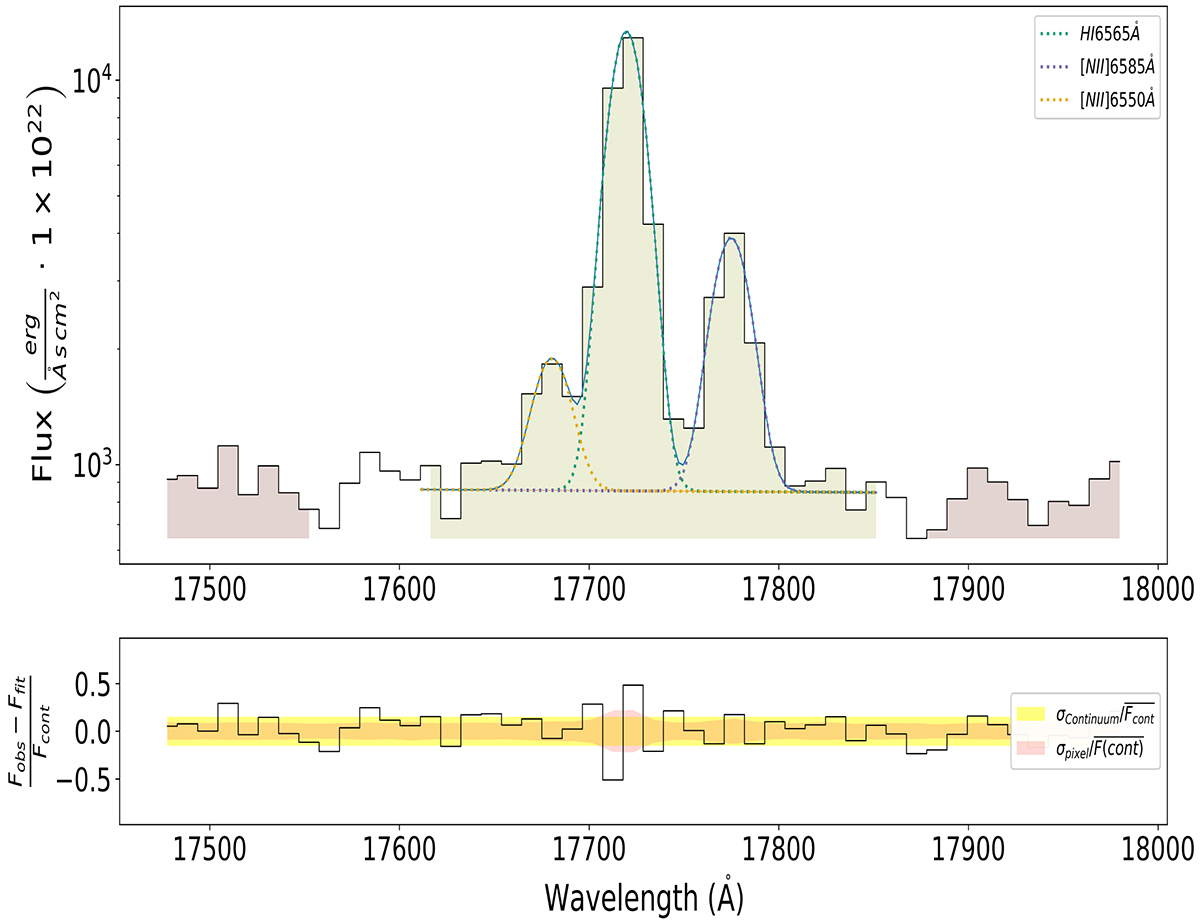
Fig. 1.
Download original image
Example of the LIME fitting process on the Hα + [NII] doublet of ID 6563 (z ∼ 1.7). The top figure shows the Gaussian profile fittings while the lower figure shows the residual between the observation and the theoretical fits. The red shade in the bottom plot shows the calibration pixel error while the yellow shade shows the standard deviation from the continua bands. The gap between the red and yellow regions is intended to avoid potential contamination of uncertain line wings and artefacts.
Current usage metrics show cumulative count of Article Views (full-text article views including HTML views, PDF and ePub downloads, according to the available data) and Abstracts Views on Vision4Press platform.
Data correspond to usage on the plateform after 2015. The current usage metrics is available 48-96 hours after online publication and is updated daily on week days.
Initial download of the metrics may take a while.