Fig. 8
Download original image
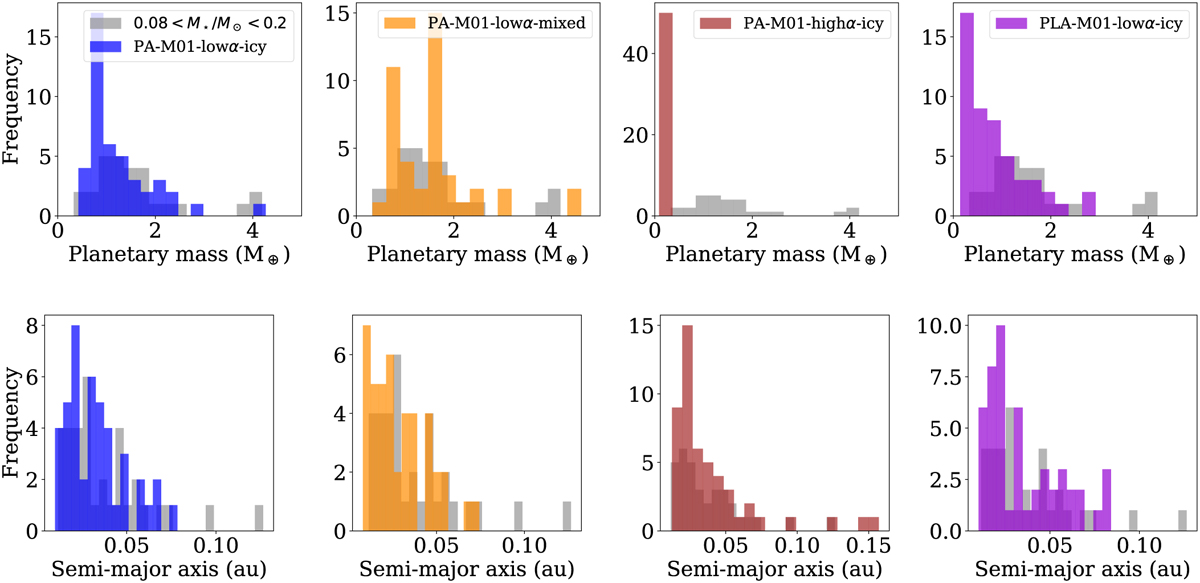
Histograms in planetary mass (top panels) and semi-major axis (bottom panels) of the observed low-mass close-in exoplanets around stars with masses 0.08 < M★/M⊙ < 0.2 (gray) and the resulting simulated planetary systems in scenario PA-M01-lowα-icy (blue), PA-M01-lowα-mixed (orange), PA-M01-highα-icy (brown), and PLA-M01-lowα-icy (violet).
Current usage metrics show cumulative count of Article Views (full-text article views including HTML views, PDF and ePub downloads, according to the available data) and Abstracts Views on Vision4Press platform.
Data correspond to usage on the plateform after 2015. The current usage metrics is available 48-96 hours after online publication and is updated daily on week days.
Initial download of the metrics may take a while.