Fig. 6
Download original image
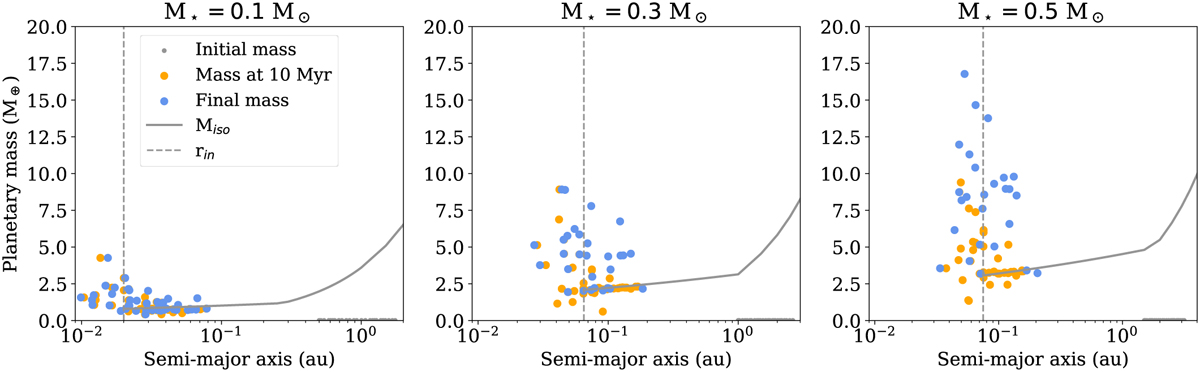
Initial masses of embryos (gray dots), planetary masses at 10 Myr, gas disk lifetime (orange dots), and final planetary masses of the simulated planets (light blue dots) together with their semi-major axis for a star of 0.1 M⊙ (left panel), 0.3 M⊙ (middle panel), and 0.5 M⊙ (right panel), for α = 10−4. The isolation mass (solid gray line) and the inner edge of the disk for each star (vertical dotted gray line) are overplotted.
Current usage metrics show cumulative count of Article Views (full-text article views including HTML views, PDF and ePub downloads, according to the available data) and Abstracts Views on Vision4Press platform.
Data correspond to usage on the plateform after 2015. The current usage metrics is available 48-96 hours after online publication and is updated daily on week days.
Initial download of the metrics may take a while.