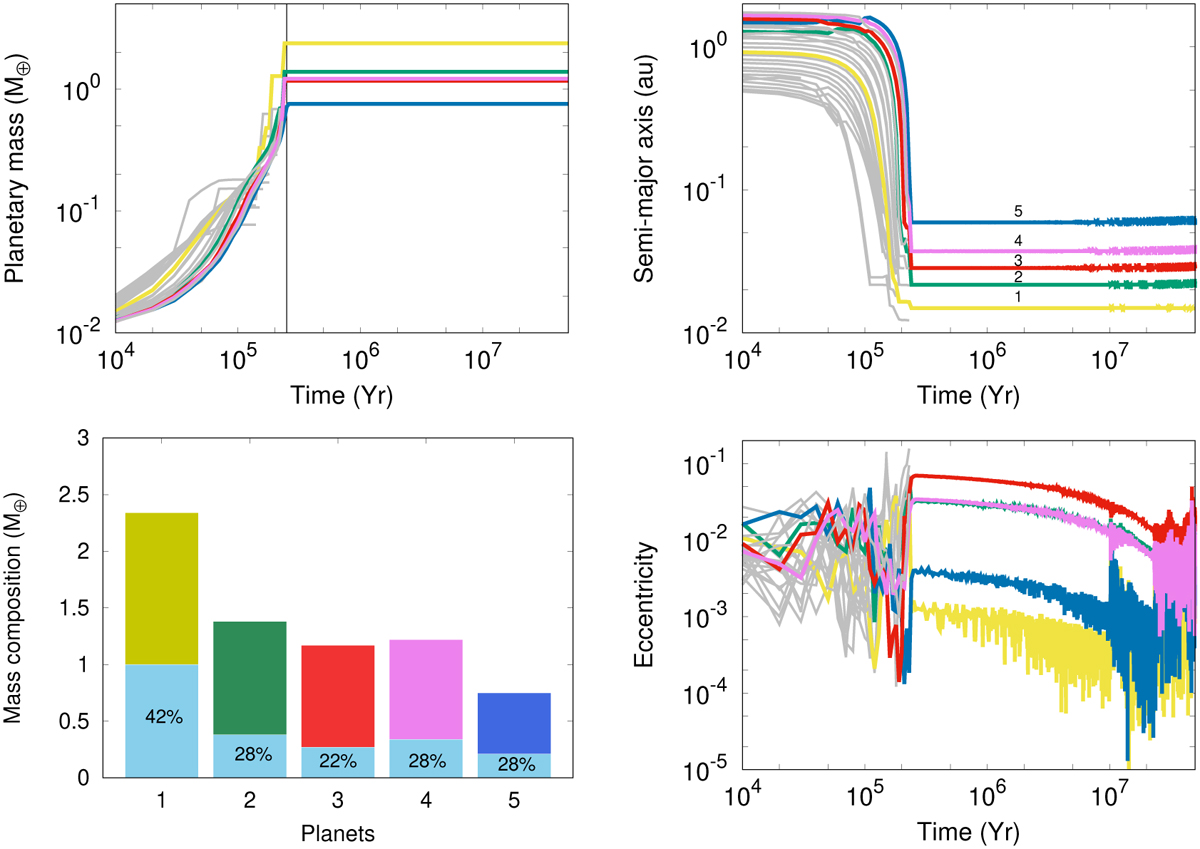
Fig. 5
Download original image
Evolution of the planetary embryo sample of one representative simulation of our standard model. Shown are the embryos that survived until the end of the simulation (colored lines), and the ones that did not survive due to collisions (gray lines). Top panels: planetary mass evolution (left) and semi-major axis evolution (right) along 50 Myr (integration time). The left vertical line represents the time when the outermost embryo reached the isolation mass. Bottom panels: final bulk composition of the resulting planets of the simulation (left) and eccentricity evolution along the integration time (right). The light blue area at the bottom of each bar represents the amount of water in mass, while the other colors are associated with the percentage of rock in each resulting planet.
Current usage metrics show cumulative count of Article Views (full-text article views including HTML views, PDF and ePub downloads, according to the available data) and Abstracts Views on Vision4Press platform.
Data correspond to usage on the plateform after 2015. The current usage metrics is available 48-96 hours after online publication and is updated daily on week days.
Initial download of the metrics may take a while.