Fig. 4
Download original image
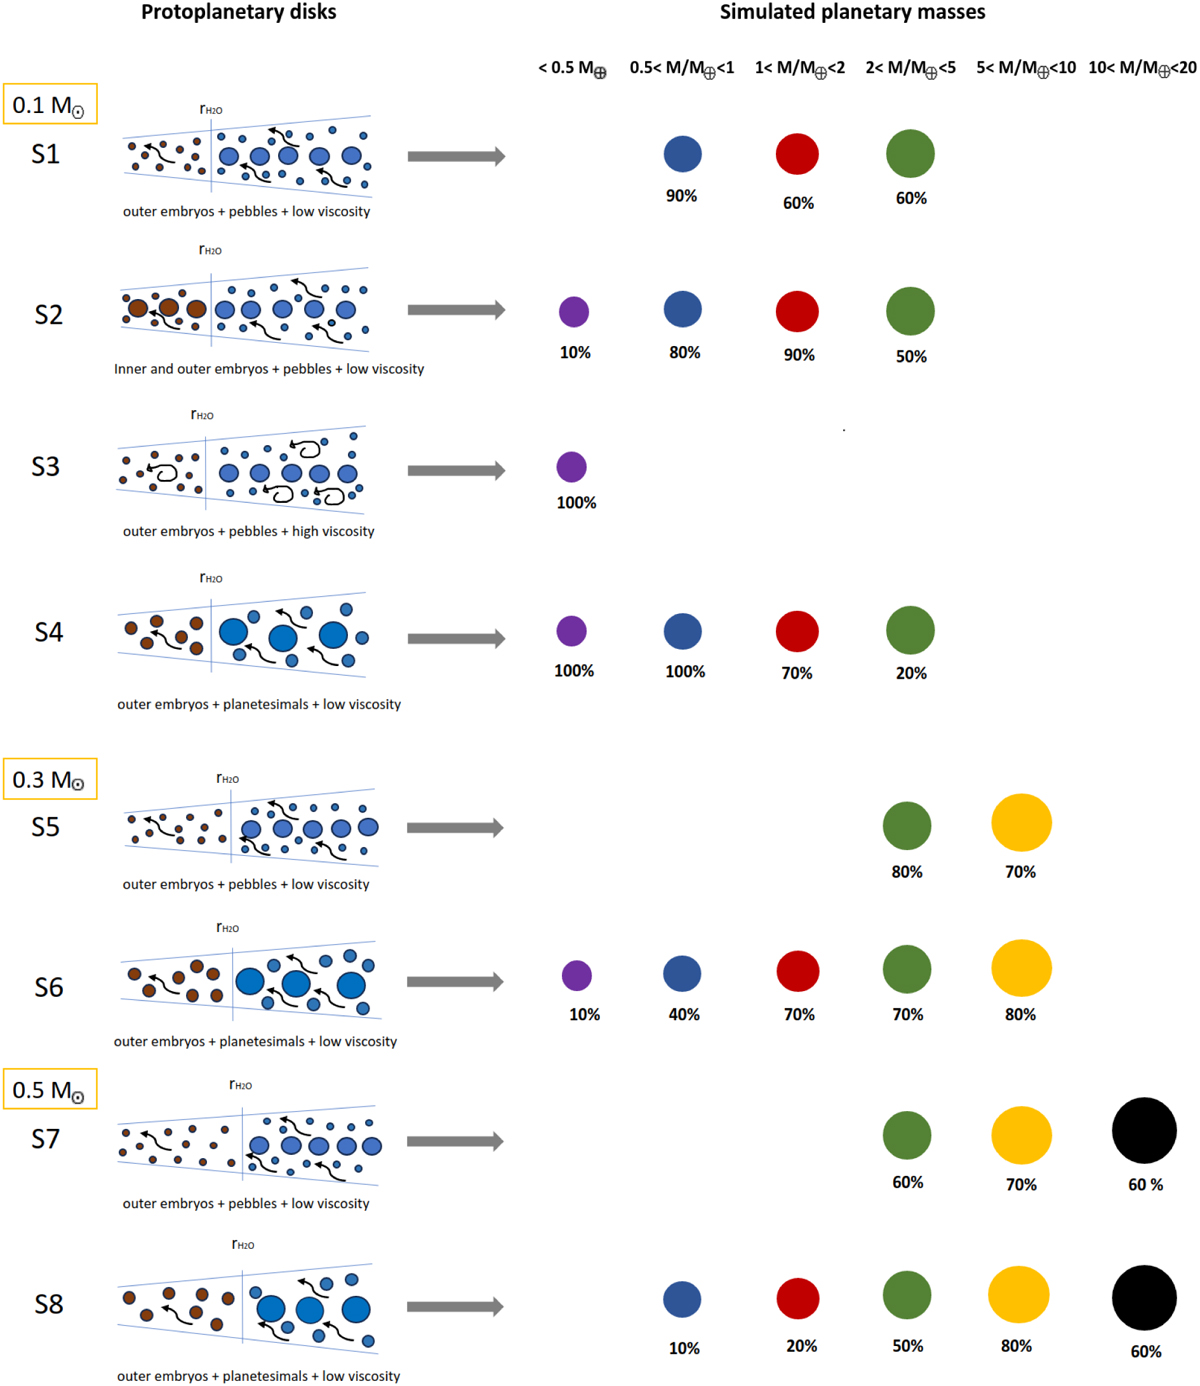
Graphic overview of the disks and final simulated planets in each formation scenario. Left: embryos of different masses (the biggest circles), and pebbles (the smallest circles) or planetesimals (medium circles) located either inside (brown) or outside (blue) the H2O snowline in a gas disk with low viscosity (curved black arrows) or high viscosity (spiral black arrows). Right: planets with masses <0.5 M⊙ (violet circles), 0.5 < M/M⊕ < 1 (blue circles), 1 < M/M⊕ < 2 (red circles), 2 < M/M⊕ < 5 (green circles), 5 < M/M⊕ < 10 (yellow circles) and 10 < M/M⊕ < 20 (black circles). The percentage of simulations in which planets in each mass range were formed is given below the circles.
Current usage metrics show cumulative count of Article Views (full-text article views including HTML views, PDF and ePub downloads, according to the available data) and Abstracts Views on Vision4Press platform.
Data correspond to usage on the plateform after 2015. The current usage metrics is available 48-96 hours after online publication and is updated daily on week days.
Initial download of the metrics may take a while.