Fig. 13
Download original image
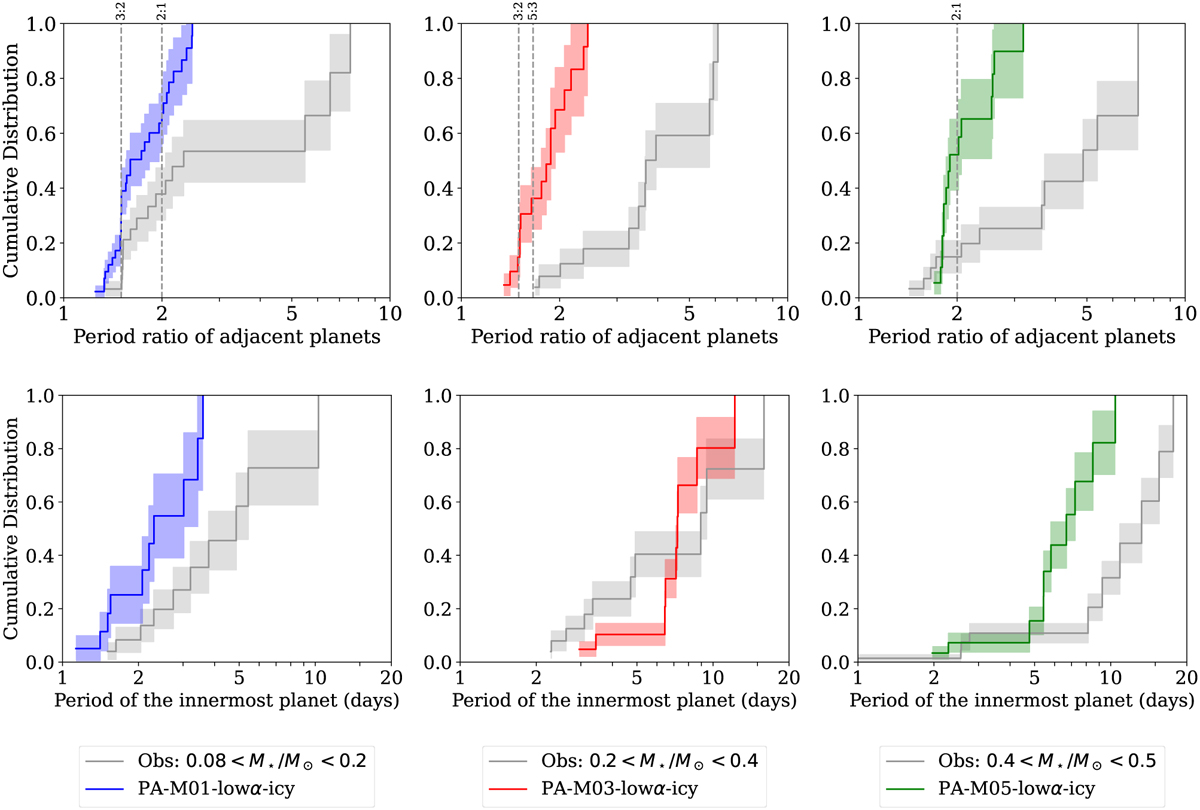
Cumulative distributions of planetary systems around M dwarfs. Left panels: Cumulative distributions of period ratio of adjacent planets (top) and of the period of the innermost planet of each system (bottom) for the simulated planets of the scenario that include pebble accretion and low gas disk viscosity for a star of 0.1 M⊙ (blue line) together with the exoplanet sample around star with 0.08 < M★/M⊙ < 0.2 (gray line). Middle panels: Analogous distributions, but comparing the simulated planets for a star of 0.3 M⊙ (red line) with the exoplanet sample around stars with 0.2 < M★/M⊙ < 0.4 (gray line). Right panels: Analogous distributions, but comparing the simulated planets from 0.5 M⊙ (green line) with the exoplanet sample around stars with 0.4 < M★/M⊙ < 0.5 (gray line). The shadow areas represent the Poissonian errors of each distribution. The representative mean motion resonances are overplotted (top panels).
Current usage metrics show cumulative count of Article Views (full-text article views including HTML views, PDF and ePub downloads, according to the available data) and Abstracts Views on Vision4Press platform.
Data correspond to usage on the plateform after 2015. The current usage metrics is available 48-96 hours after online publication and is updated daily on week days.
Initial download of the metrics may take a while.