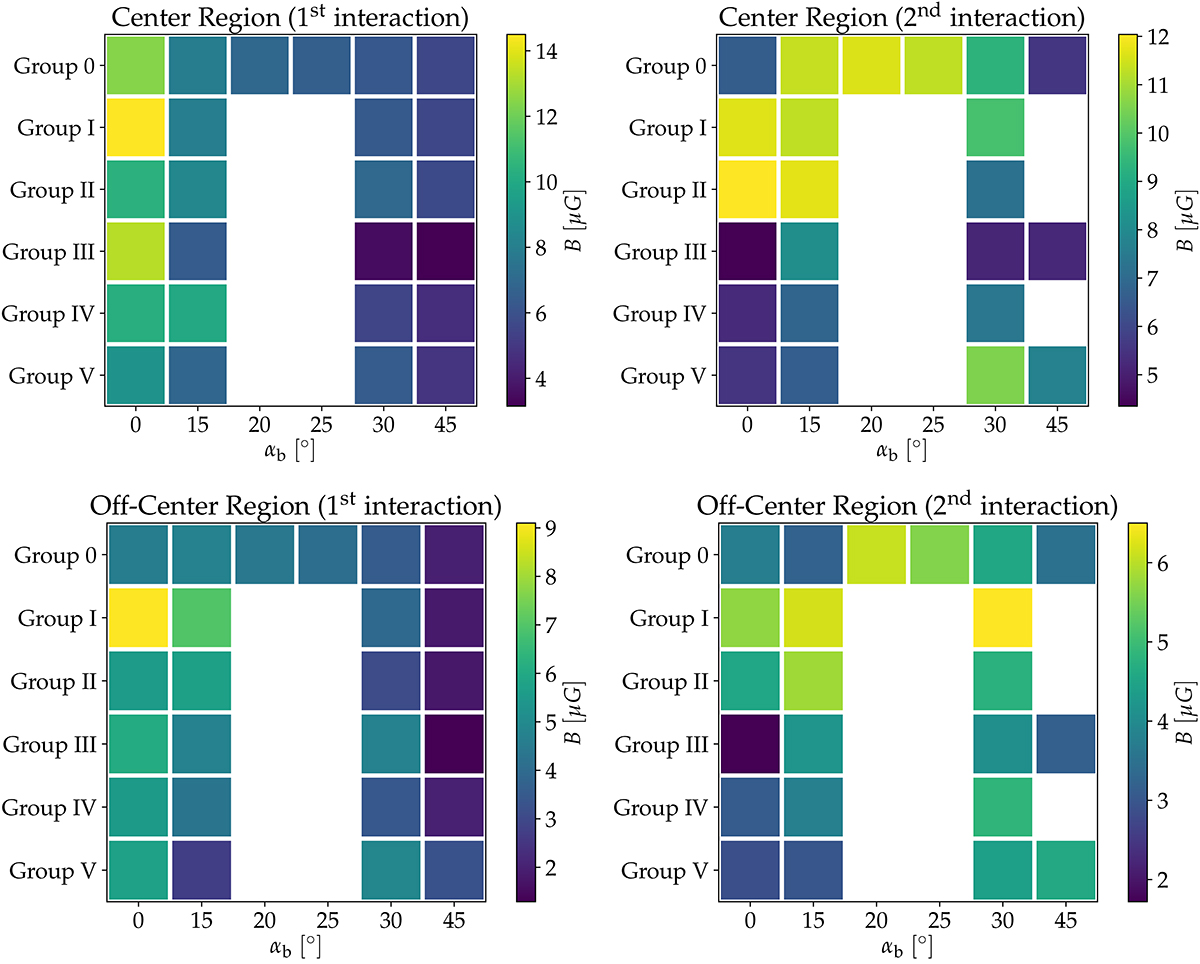
Fig. 7.
Download original image
Categorical heat maps displaying the magnetic field strength at the first interaction, ordered by impact parameter angle (αb) and simulation group. Simulations are grouped by common initial inclinations of galaxies, i.e., analogous to Table 2 Group 0: 1–6, Group I: No. 7–10, Group II: 11–14, Group III: 15–18, Group IV: 19–22, Group V: 23–26. Shown are results for center (top) and off-center (bottom) regions at the first (left) and second (right) encounters. Parameter combinations that are not covered by our simulation suite or simulations that were not evolved over a sufficiently long time to reach the second interaction are left white.
Current usage metrics show cumulative count of Article Views (full-text article views including HTML views, PDF and ePub downloads, according to the available data) and Abstracts Views on Vision4Press platform.
Data correspond to usage on the plateform after 2015. The current usage metrics is available 48-96 hours after online publication and is updated daily on week days.
Initial download of the metrics may take a while.