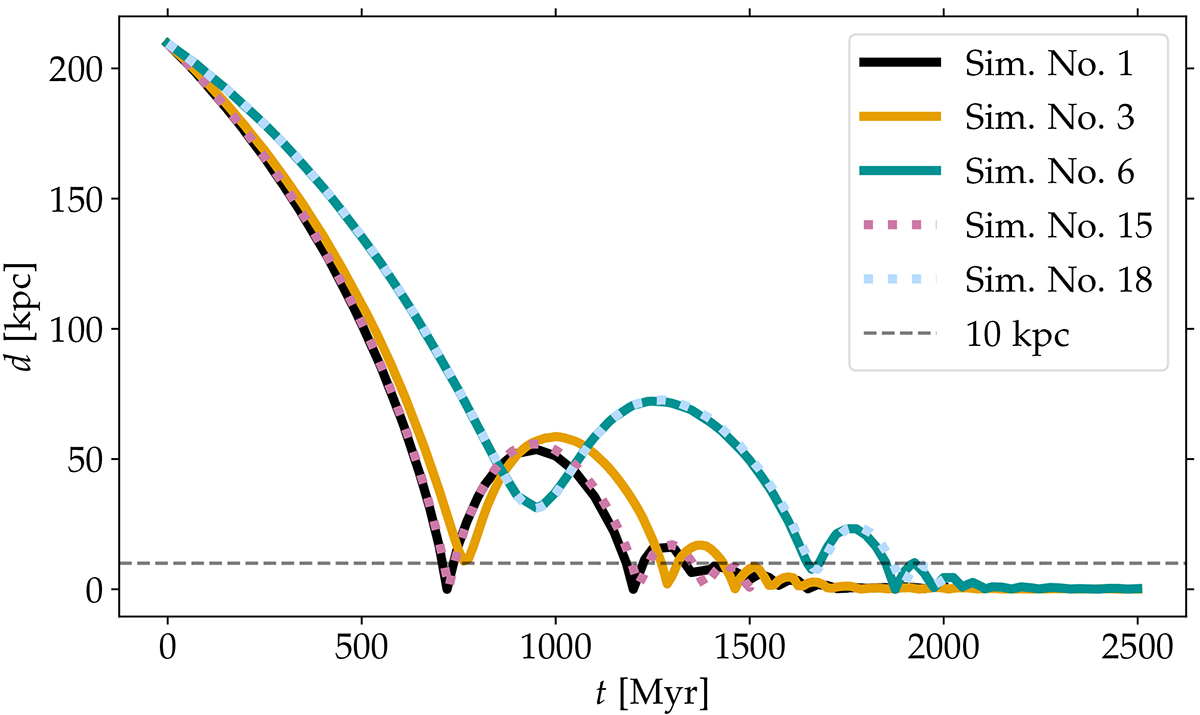
Fig. 2.
Download original image
Time evolution of the separation, d, between the centers of interacting galaxies for five cases. Sim. No. 1 and 15 are central collisions (αb = 0°) at different initial inclinations (see Table 2). For Sim. No. 3 (αb = 20°), different interaction stages are visualized in Fig. 1. Sim. No. 6 and 18 are examples for grazing interactions at αb = 45°. The dashed gray line marks a separation of 10 kpc, corresponding to the diameter of the center regions of the initial disks.
Current usage metrics show cumulative count of Article Views (full-text article views including HTML views, PDF and ePub downloads, according to the available data) and Abstracts Views on Vision4Press platform.
Data correspond to usage on the plateform after 2015. The current usage metrics is available 48-96 hours after online publication and is updated daily on week days.
Initial download of the metrics may take a while.