Open Access
Fig. 9.
Download original image
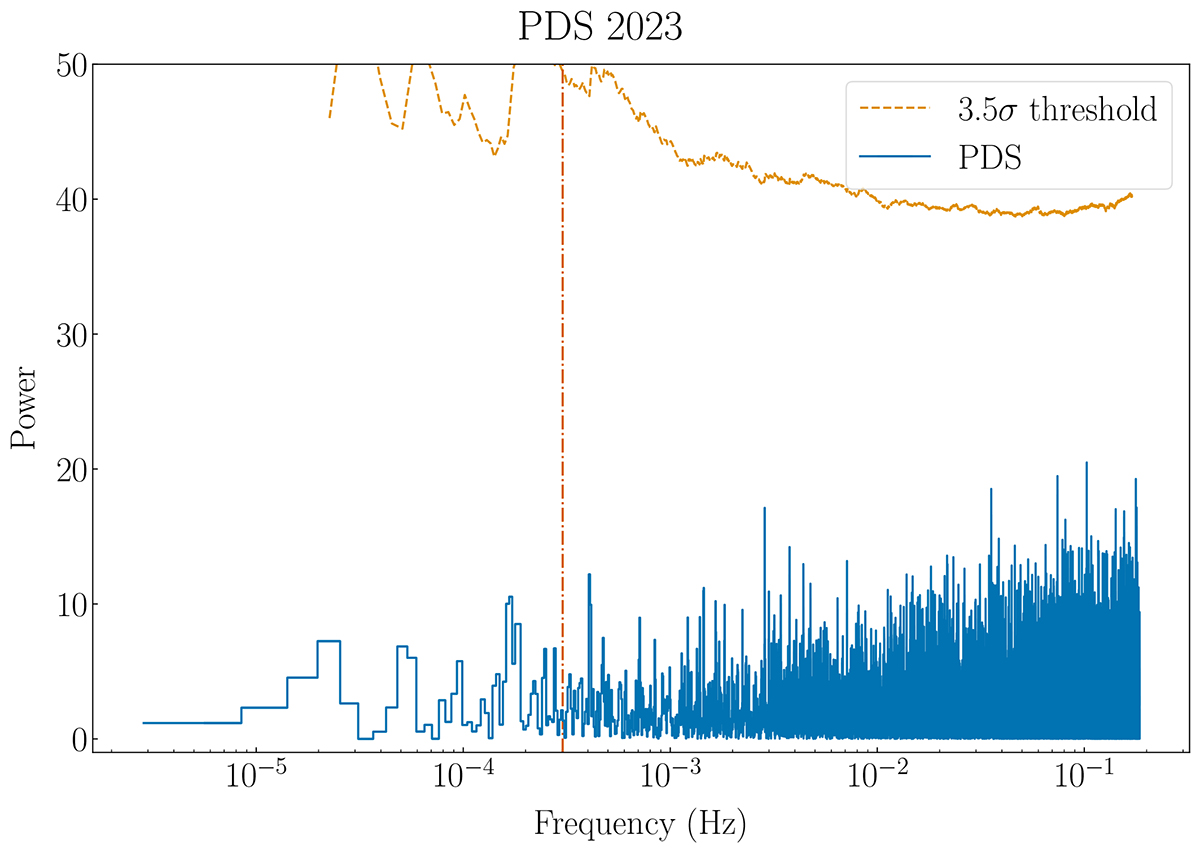
X4 PN+MOS power density spectrum in the 0.3–10 keV band during XMM2. The dash-dotted line at ≃0.3 mHz shows the frequency of the main peak detected in the PDS in XMM1. The yellow dashed line in the original PDS shows the 3.5σ detection threshold.
Current usage metrics show cumulative count of Article Views (full-text article views including HTML views, PDF and ePub downloads, according to the available data) and Abstracts Views on Vision4Press platform.
Data correspond to usage on the plateform after 2015. The current usage metrics is available 48-96 hours after online publication and is updated daily on week days.
Initial download of the metrics may take a while.