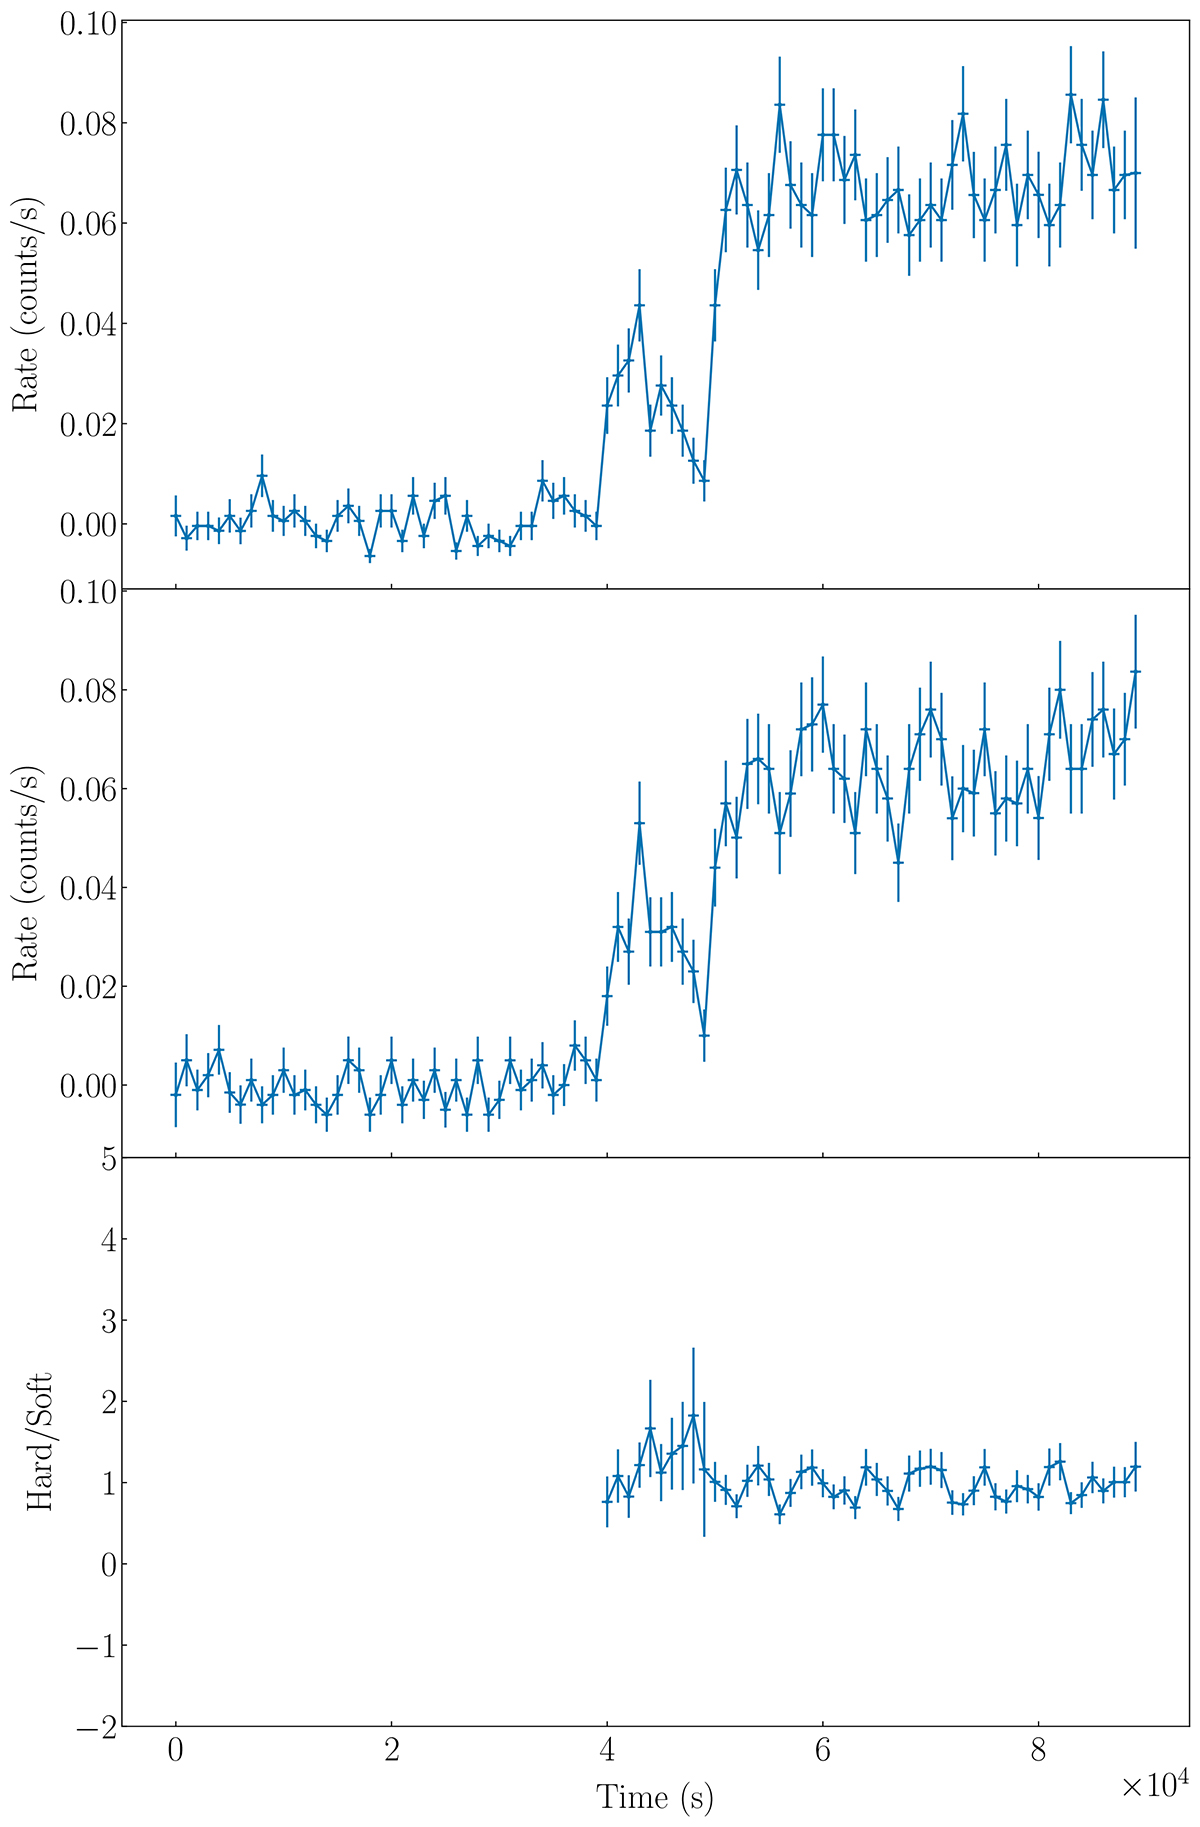
Fig. 8.
Download original image
X3 PN+MOS light curve. The top panel show the soft (0.3–1 keV) band, the middle panel the hard (1–10 keV) band, and the bottom panel the hardness ratio of the hard count rate to the soft count rate. We do not show the points in the first 40 ks since the hardness ratio in this range is dominated by noise. The bin time of the background-subtracted light curves is 1000 s.
Current usage metrics show cumulative count of Article Views (full-text article views including HTML views, PDF and ePub downloads, according to the available data) and Abstracts Views on Vision4Press platform.
Data correspond to usage on the plateform after 2015. The current usage metrics is available 48-96 hours after online publication and is updated daily on week days.
Initial download of the metrics may take a while.