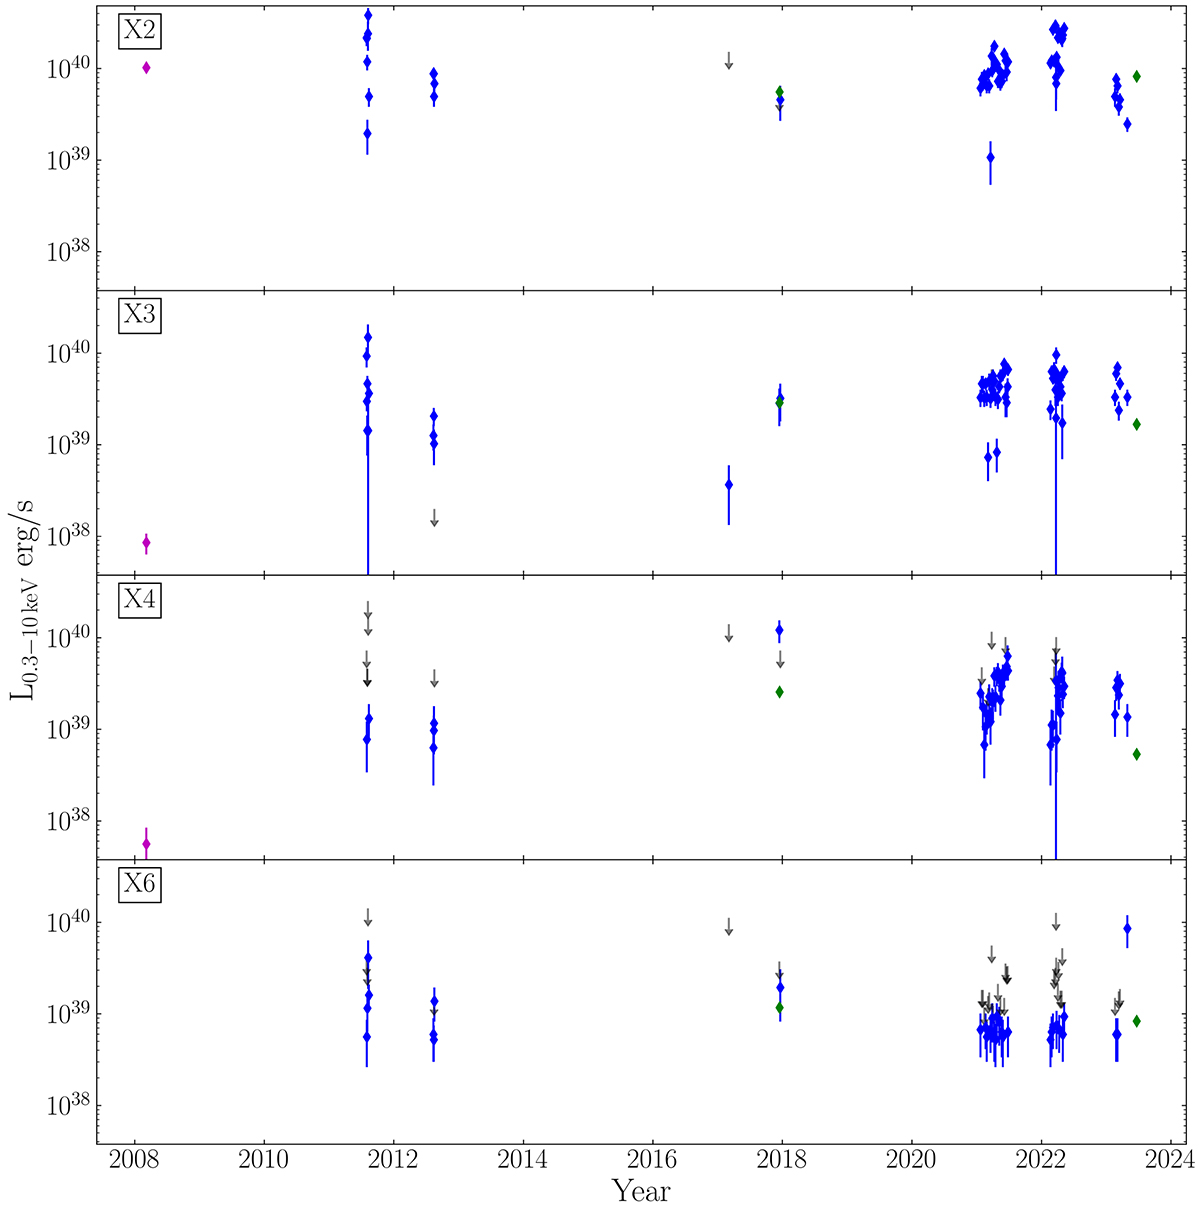
Fig. 6.
Download original image
Long-term X-ray light curves of the source X1–X6 (from top to bottom). The magenta, green, and blue points indicate Chandra, XMM-Newton, and Swift/XRT data, respectively. Down-pointing arrows indicate 3σ upper limits. Swift/XRT upper limits are in grey. XMM-Newton/pn and XMM-Newton/MOS upper limits are shown by two different arrows. The count rates on which this figure is built are reported in Table B.1.
Current usage metrics show cumulative count of Article Views (full-text article views including HTML views, PDF and ePub downloads, according to the available data) and Abstracts Views on Vision4Press platform.
Data correspond to usage on the plateform after 2015. The current usage metrics is available 48-96 hours after online publication and is updated daily on week days.
Initial download of the metrics may take a while.