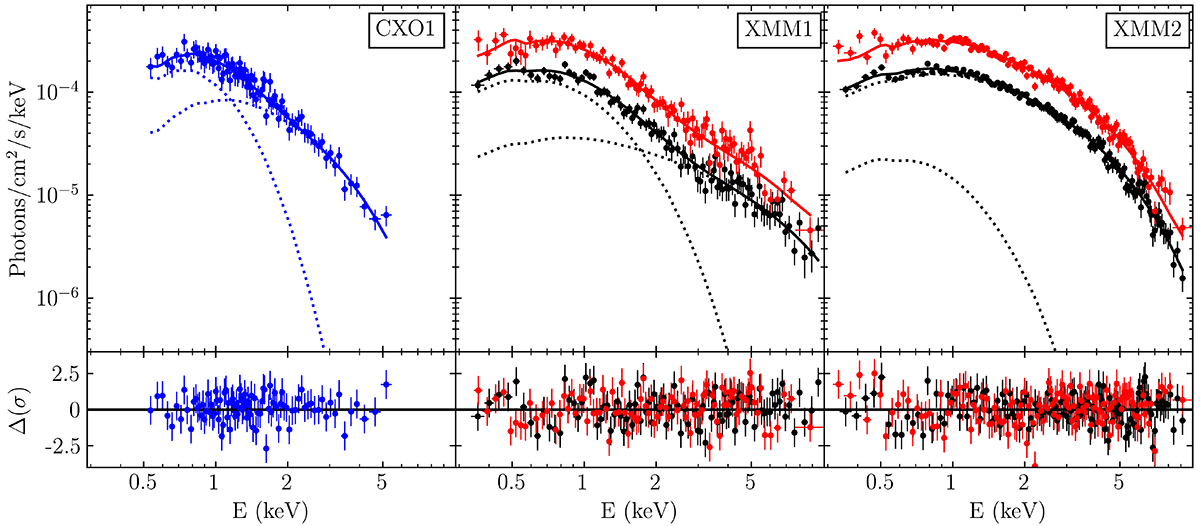
Fig. 2.
Download original image
X-ray spectrum (upper panels) and residuals (lower panels) of the source labelled X2 in the three different epochs. Shown in blue are the Chandra data, in black the XMM-Newton/pn data, and in red the merged XMM-Newton/MOS data. The solid lines show the best-fitting models described in the text. The individual components contributing to the model are shown as dotted lines (for XMM1 and XMM2 the two components are shown only for the pn dataset for clarity).
Current usage metrics show cumulative count of Article Views (full-text article views including HTML views, PDF and ePub downloads, according to the available data) and Abstracts Views on Vision4Press platform.
Data correspond to usage on the plateform after 2015. The current usage metrics is available 48-96 hours after online publication and is updated daily on week days.
Initial download of the metrics may take a while.