Fig. 4
Download original image
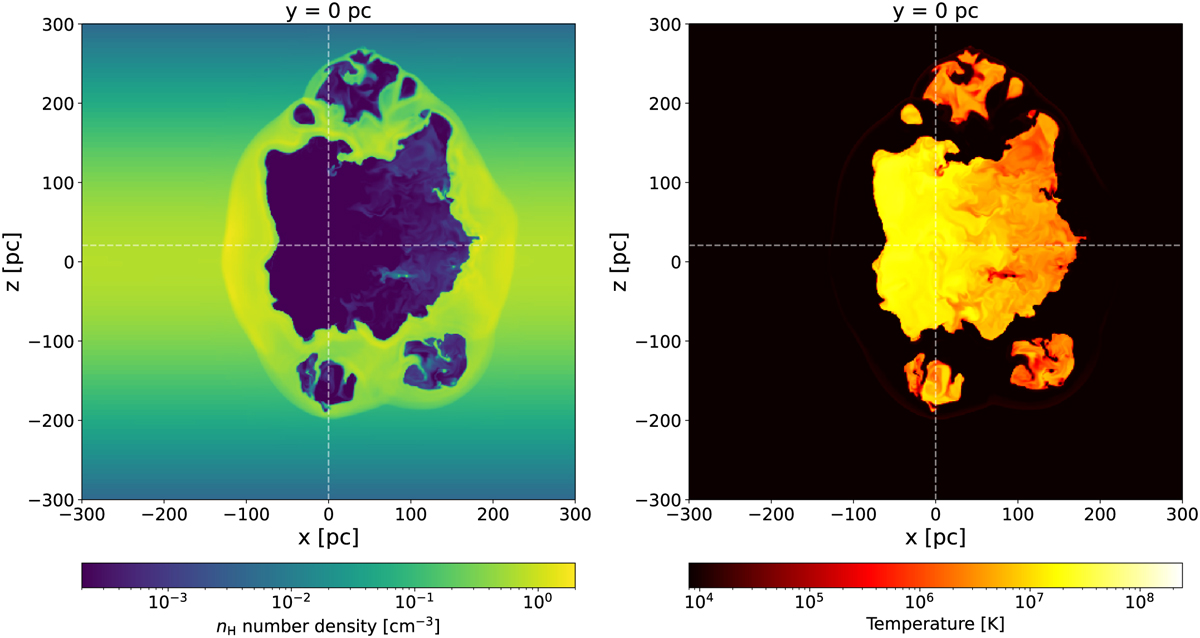
Slices at y = 0 pc through the Schulreich et al. (2023) simulation for the neutral hydrogen number density (left) and the temperature (right). The gas outside the Local Bubble is shaped according to the Galactic plane density distribution, decreasing exponentially towards higher |ɀ|. Small clumps of higher-density gas inside the bubble are visible in both panels, for example around (x, ɀ) = (80, −20) pc. The hot gas is naturally correlated with thin phases of the ISM, and the bubble walls are at a temperature of 8000 K or below. The position of the Sun is marked with dashed grey lines at ɀ = 20.8 pc.
Current usage metrics show cumulative count of Article Views (full-text article views including HTML views, PDF and ePub downloads, according to the available data) and Abstracts Views on Vision4Press platform.
Data correspond to usage on the plateform after 2015. The current usage metrics is available 48-96 hours after online publication and is updated daily on week days.
Initial download of the metrics may take a while.