Fig. 12
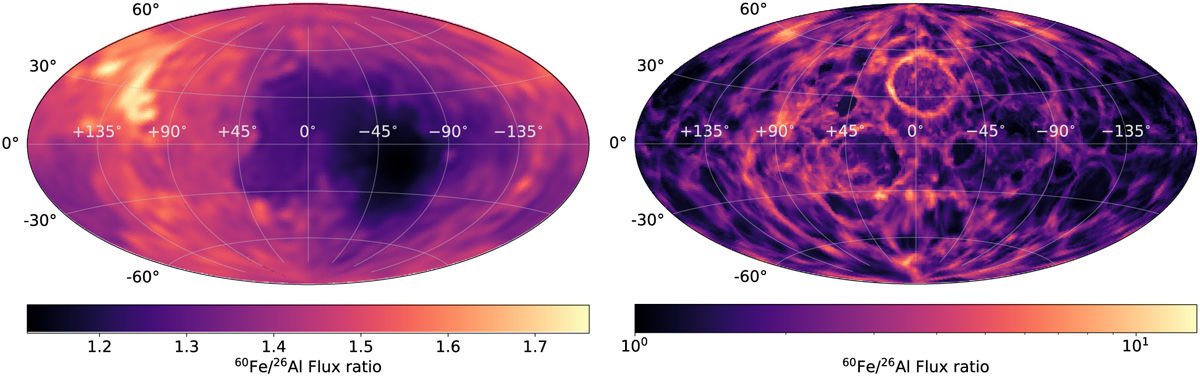
Download original image
Flux ratio per pixel of the 1332keV line from 60Fe versus the 1809keV line from 26Al. Left: case 1. Right: case 2. It is seen that the hot spots from 26Al in Fig. 7 are turned into cold spots in these flux ratio maps. The reason is again the 3.8 longer lifetime of 60Fe which lets the γ-ray emission of this isotope appear more homogeneous. We note the scales of the flux ratio maps: in case 1, the contrast is particularly small, whereas in case 2, the strong accumulation in of 60Fe already-mixed in the bubble walls increases the contrast up to a factor of 10.
Current usage metrics show cumulative count of Article Views (full-text article views including HTML views, PDF and ePub downloads, according to the available data) and Abstracts Views on Vision4Press platform.
Data correspond to usage on the plateform after 2015. The current usage metrics is available 48-96 hours after online publication and is updated daily on week days.
Initial download of the metrics may take a while.