Fig. 10
Download original image
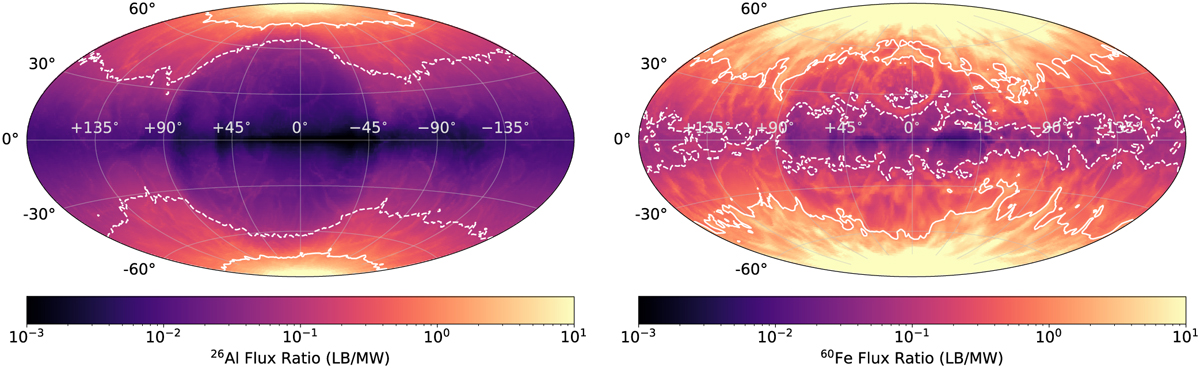
Flux ratios of the Local Bubble (LB) all-sky maps (case 2a) and the Milky Way (MW) model for the 26Al (left) and 60Fe lines. The solid (dashed) lines show the regions where the Local Bubble is at least 1.0 (0.1) as strong as the Milky Way. The typical values for when the Local Bubble contribution might be stronger than the Galactic background shown here for 26Al and 60Fe are |b| ≳ 73° and |b| ≳ 48°, respectively.
Current usage metrics show cumulative count of Article Views (full-text article views including HTML views, PDF and ePub downloads, according to the available data) and Abstracts Views on Vision4Press platform.
Data correspond to usage on the plateform after 2015. The current usage metrics is available 48-96 hours after online publication and is updated daily on week days.
Initial download of the metrics may take a while.