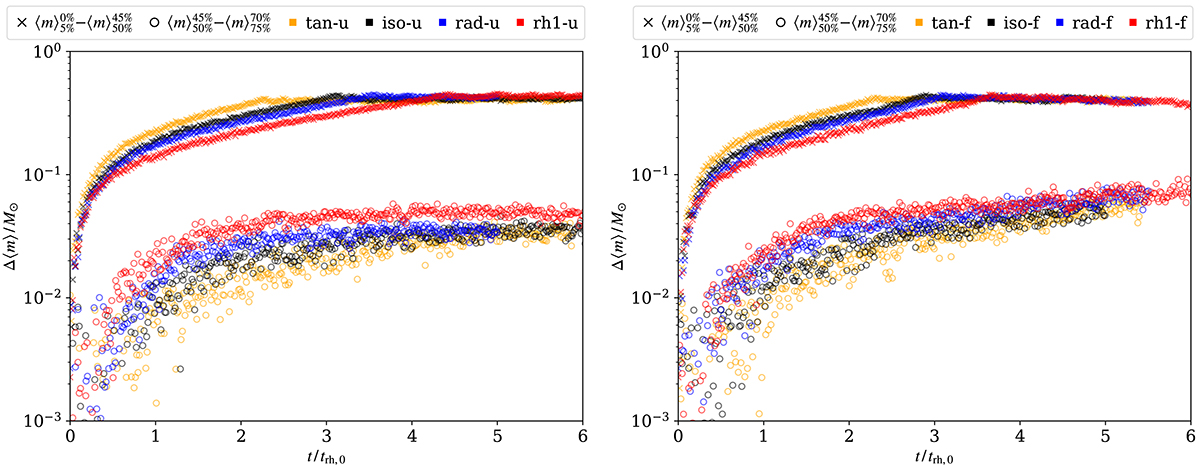
Fig. 7.
Download original image
Evolution of mass segregation in the SCs. We compare the mean mass in the core and around the half-mass radius (crosses), and around the half-mass radius and in the outer regions (circles). The ranges of Lagrangian radii from which the mean mass is taken are specified as mass percentages in the labels. The underfilling models are shown in the left-hand panel, and the filling ones in the right-hand panel.
Current usage metrics show cumulative count of Article Views (full-text article views including HTML views, PDF and ePub downloads, according to the available data) and Abstracts Views on Vision4Press platform.
Data correspond to usage on the plateform after 2015. The current usage metrics is available 48-96 hours after online publication and is updated daily on week days.
Initial download of the metrics may take a while.