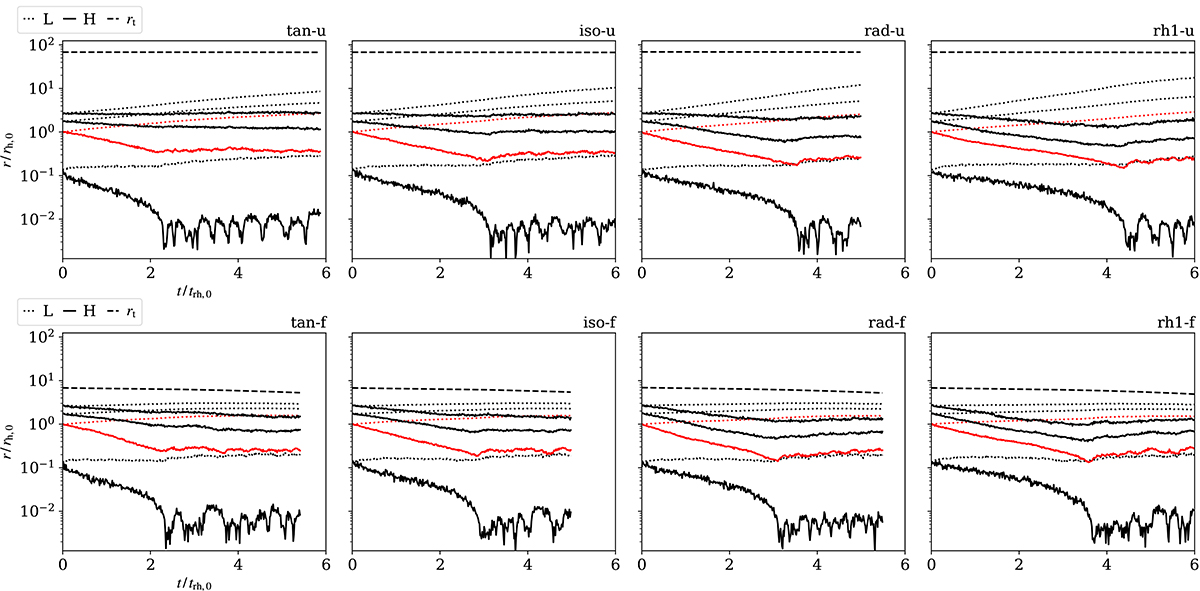
Fig. 6.
Download original image
Time evolution of the Lagrangian radii of two stellar mass groups: low-mass (‘L’, m ≤ 0.2 M⊙, dotted lines) and high-mass (‘H’, m ≥ 0.9 M⊙, solid lines). The curves represent 1, 50, 75, and 90% of the total mass of the corresponding mass group (from bottom to top; the half-mass radius is also highlighted in red). The cluster tidal radius is the top dashed line.
Current usage metrics show cumulative count of Article Views (full-text article views including HTML views, PDF and ePub downloads, according to the available data) and Abstracts Views on Vision4Press platform.
Data correspond to usage on the plateform after 2015. The current usage metrics is available 48-96 hours after online publication and is updated daily on week days.
Initial download of the metrics may take a while.