Open Access
Fig. 9
Download original image
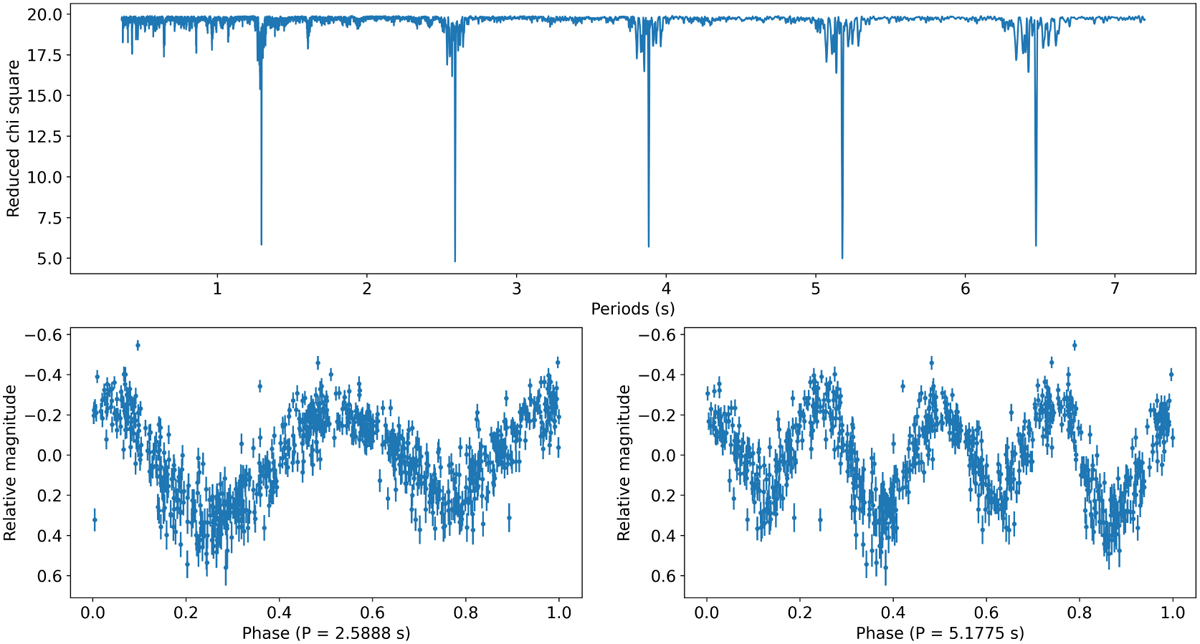
Results of the period search for BX1. Upper plot: periodogram of all the observations of BX1 testing periods between 0.36 and 7.2 s. We see a clear minimum at 2.5888 s and its aliases. Bottom: observations phased according to the two best results, 2.5888 and 5.1775 s.
Current usage metrics show cumulative count of Article Views (full-text article views including HTML views, PDF and ePub downloads, according to the available data) and Abstracts Views on Vision4Press platform.
Data correspond to usage on the plateform after 2015. The current usage metrics is available 48-96 hours after online publication and is updated daily on week days.
Initial download of the metrics may take a while.