Fig. 5
Download original image
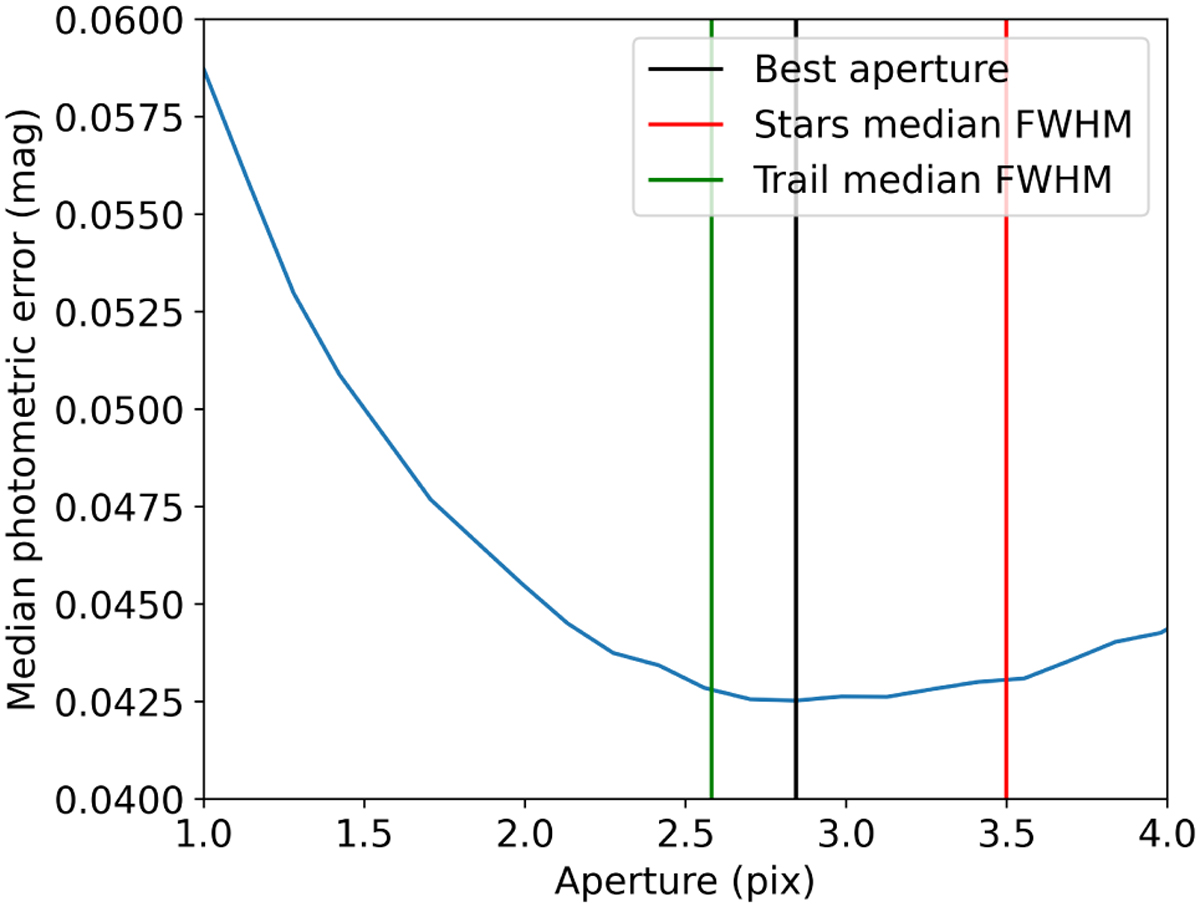
Growth curve of the median of the theoretical uncertainty for all measurements along the trail. The minimum of the curve (represented by the vertical black line) corresponds to the computed optimal aperture (2.8 pixels here). The vertical green line corresponds to the median FWHM of the trail (2.55 pixels), while the vertical red line corresponds to the median FWHM of all the stars in the field (3.5 pixels).
Current usage metrics show cumulative count of Article Views (full-text article views including HTML views, PDF and ePub downloads, according to the available data) and Abstracts Views on Vision4Press platform.
Data correspond to usage on the plateform after 2015. The current usage metrics is available 48-96 hours after online publication and is updated daily on week days.
Initial download of the metrics may take a while.