Fig. 4
Download original image
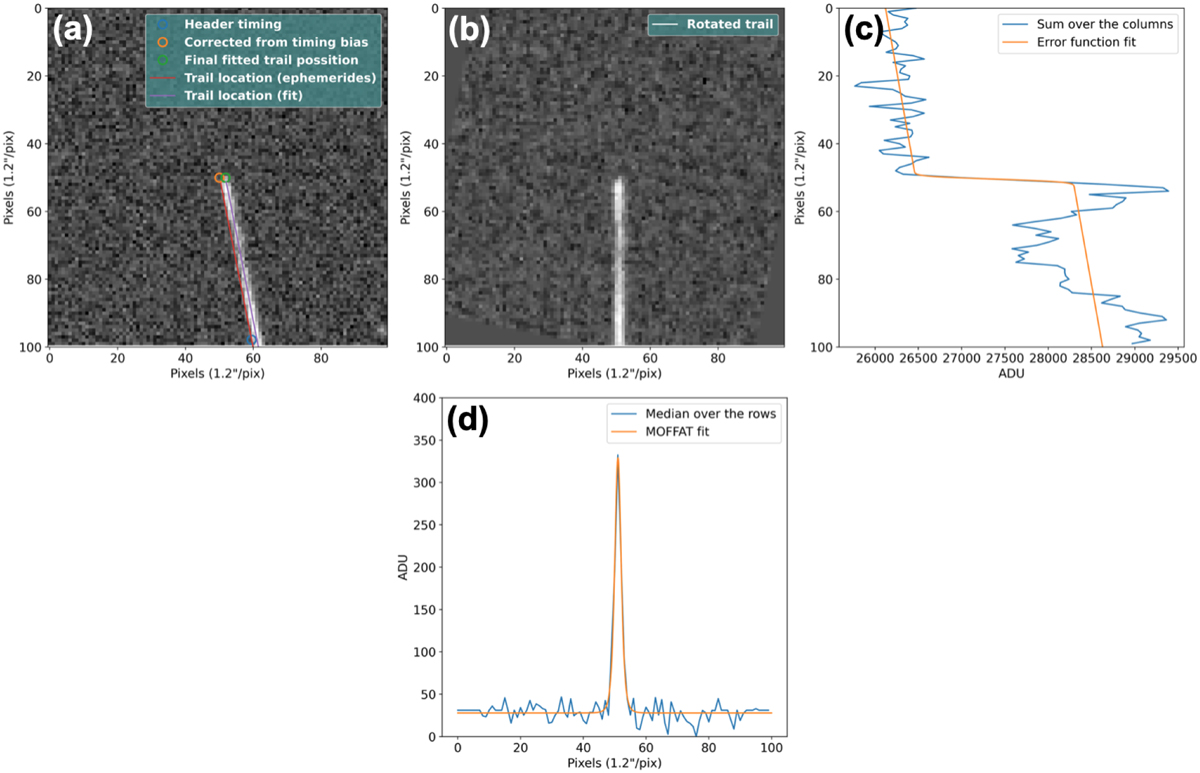
Determination of the location of the trail. (a) Cropped image around one end of the trail. The blue circle (located around the coordinates (60,100)) represents the expected position of the asteroid at the beginning or end of the exposure based on the ephemerides and the time read from the fits header. The orange circle corresponds to the expected position of the asteroid at the beginning or end of the exposure after correcting for the time bias in the header, while the green circle corresponds to the true position of the object after fitting the end of the trail. (b) Same image as (a) but after rotation to align the trail with the y-axis. (c) Sum of the flux after adding pixels along the rows. The blue line is fitted with an error function to locate at which row the trail starts. We note that the variation in the flux of the asteroid due to its rotation is already visible in the blue curve. (d) Median flux integrated along the columns of pixels. The blue line is fitted with a Moffat function to determine in what column the trail is located.
Current usage metrics show cumulative count of Article Views (full-text article views including HTML views, PDF and ePub downloads, according to the available data) and Abstracts Views on Vision4Press platform.
Data correspond to usage on the plateform after 2015. The current usage metrics is available 48-96 hours after online publication and is updated daily on week days.
Initial download of the metrics may take a while.