Open Access
Fig. 10
Download original image
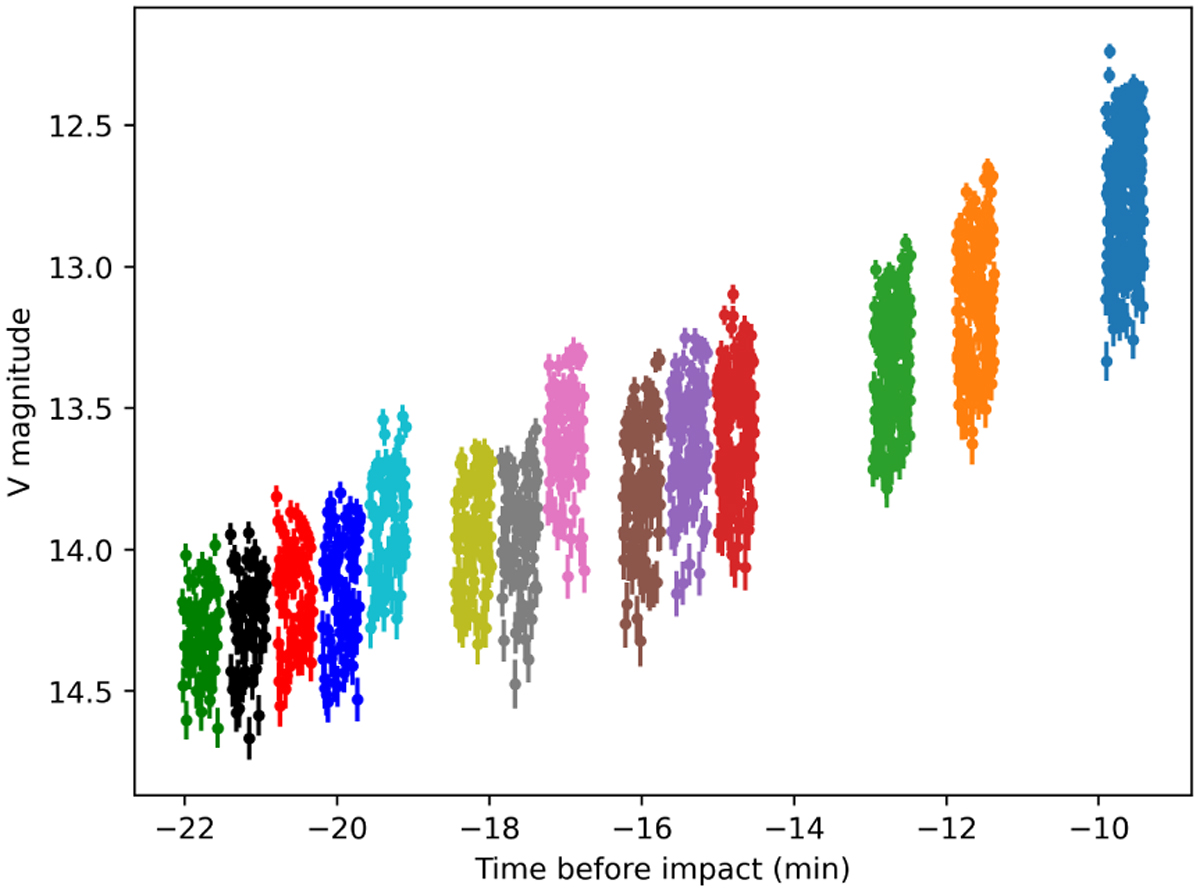
Photometry of BX1 derived from all trailed images. Each color represents a different image of 30 s each. The x-axis gives the time in minutes before the impact time, while the y-axis is the magnitude in the V band.
Current usage metrics show cumulative count of Article Views (full-text article views including HTML views, PDF and ePub downloads, according to the available data) and Abstracts Views on Vision4Press platform.
Data correspond to usage on the plateform after 2015. The current usage metrics is available 48-96 hours after online publication and is updated daily on week days.
Initial download of the metrics may take a while.