Fig. 7.
Download original image
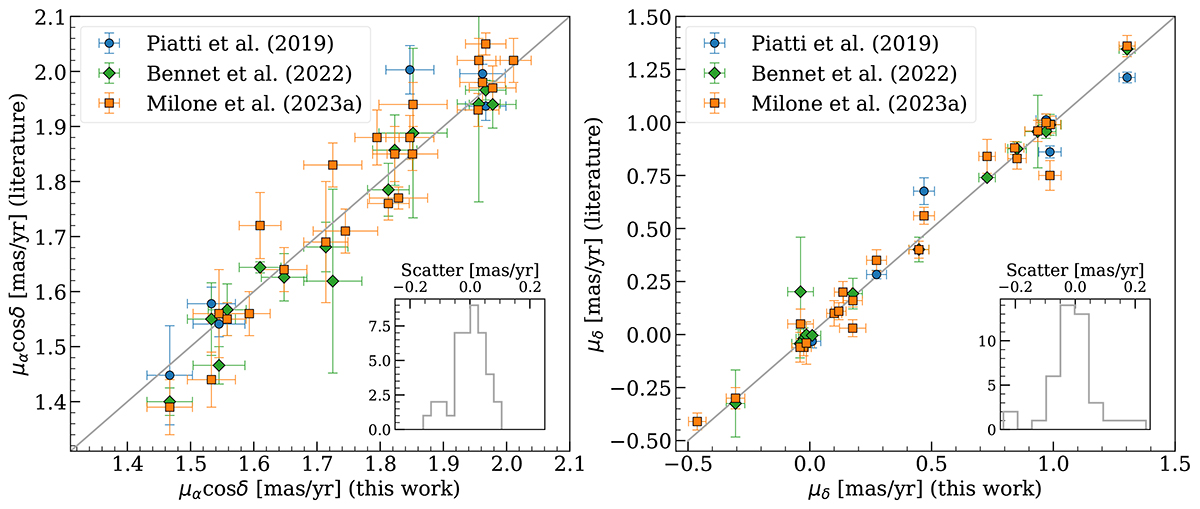
Comparison between the HST-based absolute motions of the clusters presented in this work and measurements from the literature. The grey lines follow a one-to-one relation and are not a fit to the data. The insets within the two panels show the distribution of the points perpendicular to the grey line, illustrating the differences in the measurements.
Current usage metrics show cumulative count of Article Views (full-text article views including HTML views, PDF and ePub downloads, according to the available data) and Abstracts Views on Vision4Press platform.
Data correspond to usage on the plateform after 2015. The current usage metrics is available 48-96 hours after online publication and is updated daily on week days.
Initial download of the metrics may take a while.