Open Access
Fig. 9
Download original image
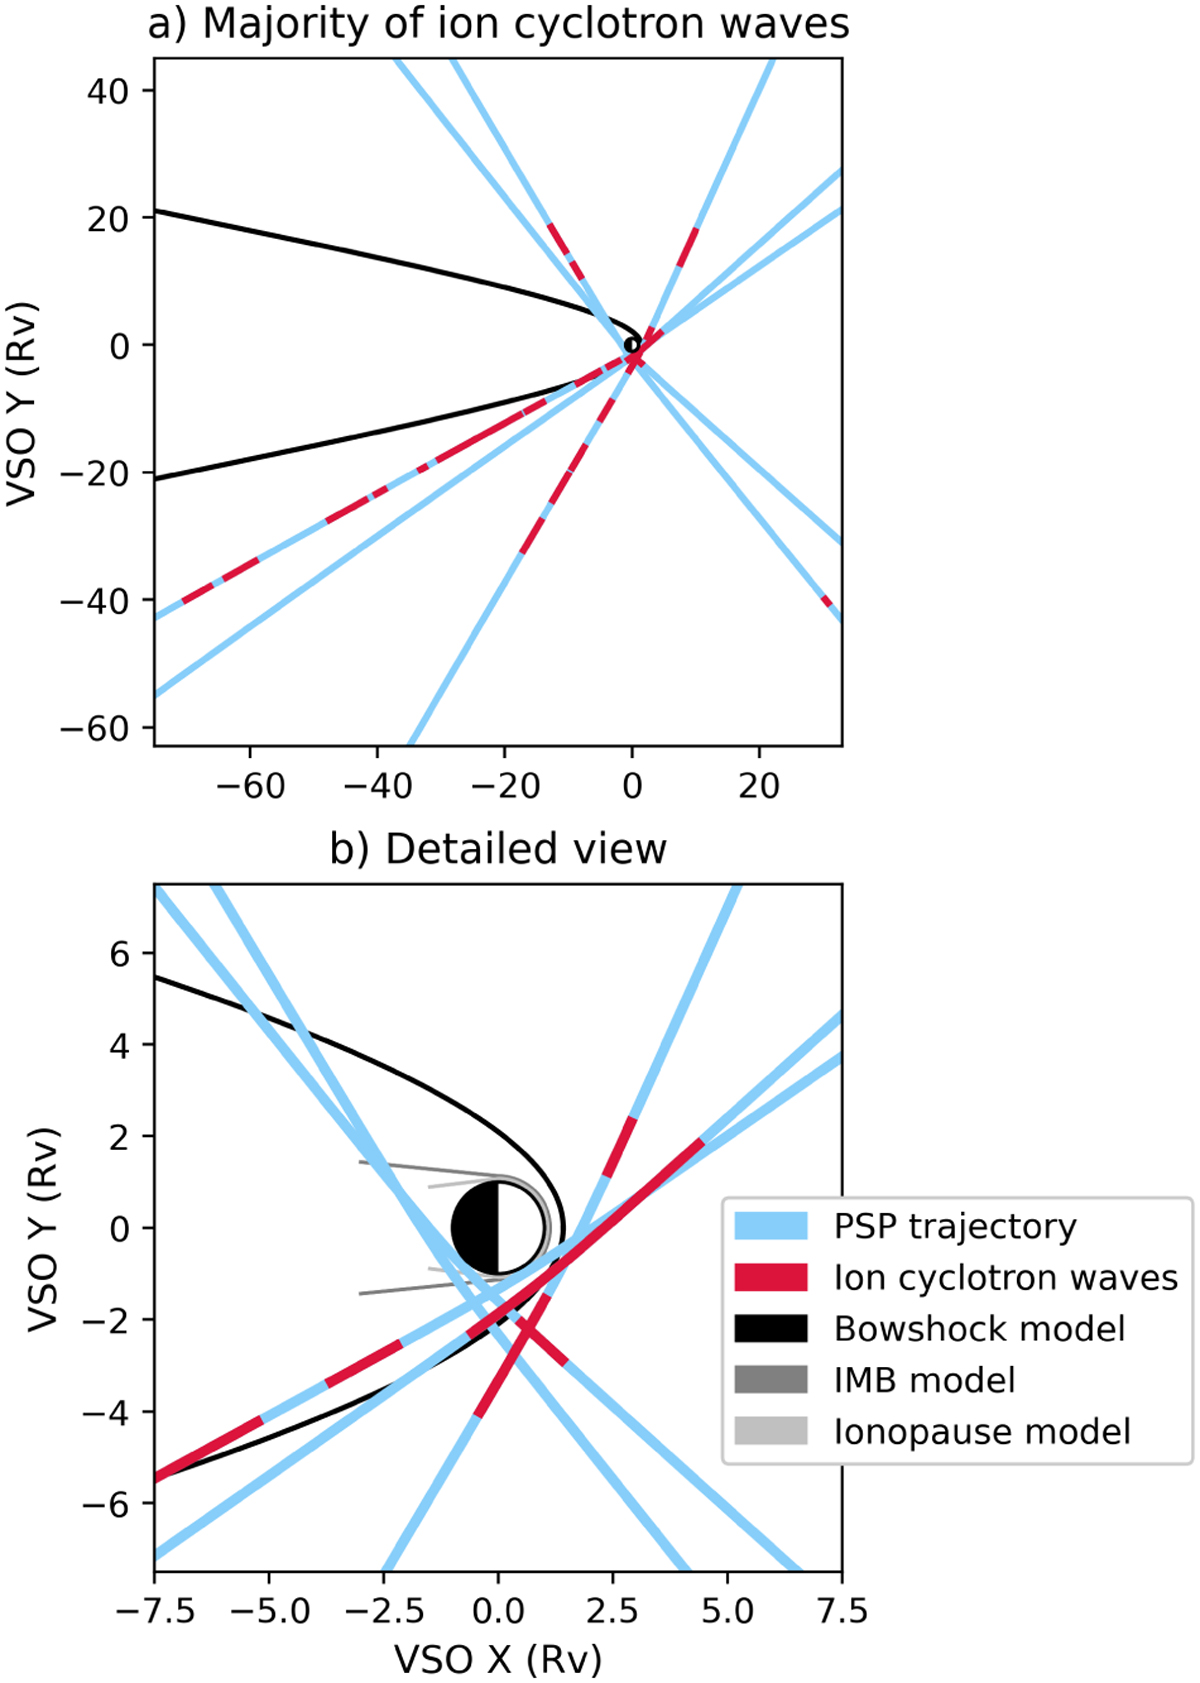
Distribution of ion cyclotron waves throughout near-Venus space, in the same format as Figure 2. Some waves that were detected during VGA5 are not shown in subplot a as they were large distances away from Venus, but Table D.1 in the appendix provides the times and locations where all ICW were detected.
Current usage metrics show cumulative count of Article Views (full-text article views including HTML views, PDF and ePub downloads, according to the available data) and Abstracts Views on Vision4Press platform.
Data correspond to usage on the plateform after 2015. The current usage metrics is available 48-96 hours after online publication and is updated daily on week days.
Initial download of the metrics may take a while.