Fig. 6
Download original image
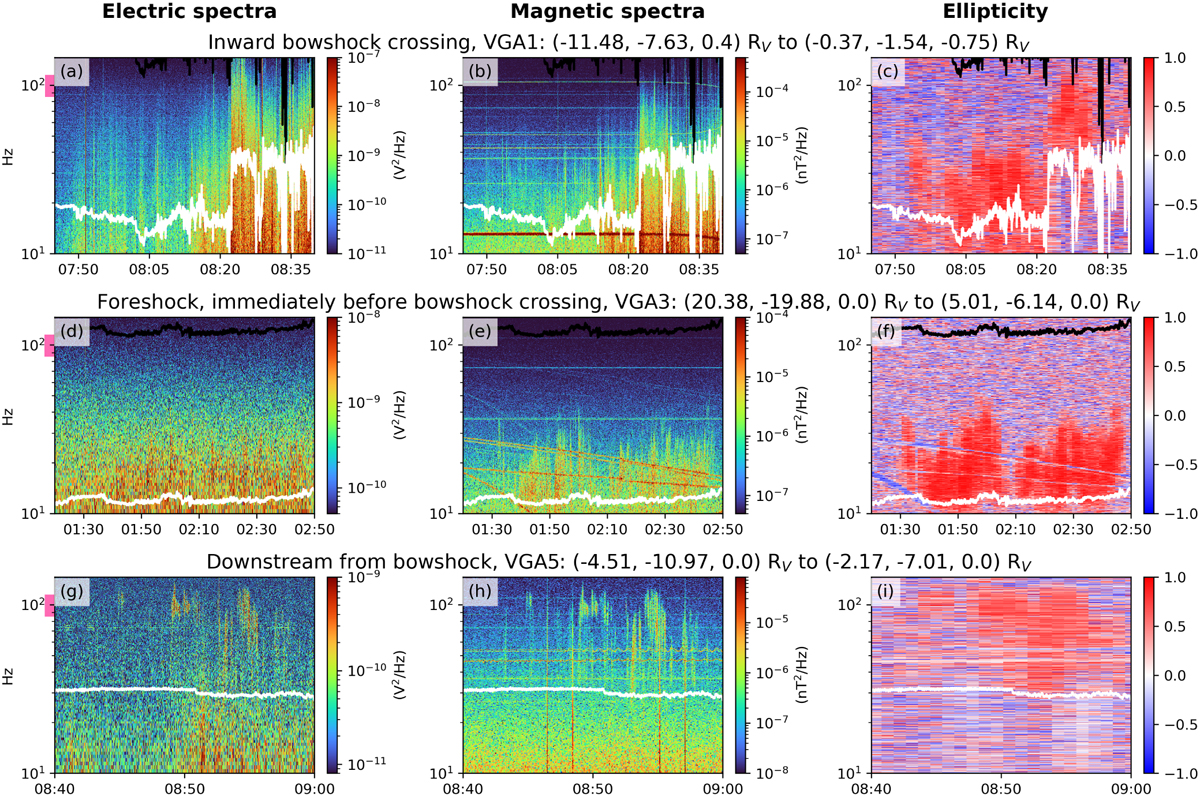
Examples of whistler-mode waves detected near Venus, with each row showing a different wave. Subplots a, d and g show the electric field spectra calculated from the FFT of the differential voltage timeseries data, and subplots b, e and h show the FFT of the SCM timeseries data. Subplots c, f and i show the ellipticity calculated from the SCM data. The black (white) overlaid line shows fce (0.1 fce). The subtitle of each row gives the locations of PSP in VSO coordinates at the start and end of the plotted timeframes. The pink bar on the y-axes of the left subplots show the frequency coverage of the 100 Hz channel of the PVO OEFD instrument.
Current usage metrics show cumulative count of Article Views (full-text article views including HTML views, PDF and ePub downloads, according to the available data) and Abstracts Views on Vision4Press platform.
Data correspond to usage on the plateform after 2015. The current usage metrics is available 48-96 hours after online publication and is updated daily on week days.
Initial download of the metrics may take a while.