Fig. 3
Download original image
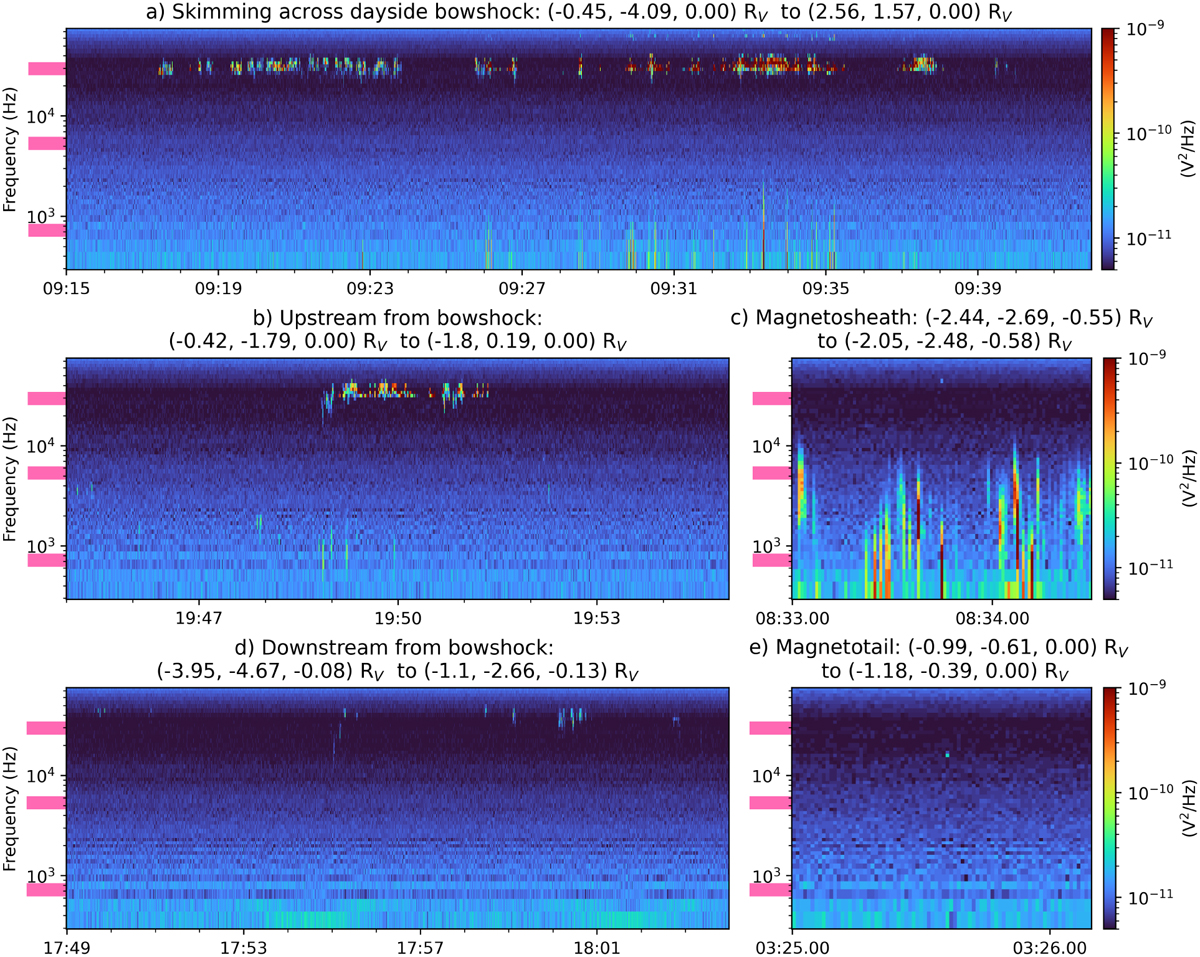
Examples of the Langmuir waves detected in different plasma regions of near-Venus space using the DFB on board differential voltage power spectra. Subplots a, b, c and e show the dV12 data and subplot d shows the dV34 data. All subplots have the same colorscale and the subtitles give the initial and final locations of PSP in VSO coordinates over the plotted timeframes. The three pink bars on the y-axis of each subplot illustrate the frequency range of the 730 Hz, 5.4 kHz and 30 kHz channels of the PVO OEFD instrument.
Current usage metrics show cumulative count of Article Views (full-text article views including HTML views, PDF and ePub downloads, according to the available data) and Abstracts Views on Vision4Press platform.
Data correspond to usage on the plateform after 2015. The current usage metrics is available 48-96 hours after online publication and is updated daily on week days.
Initial download of the metrics may take a while.