Fig. 2
Download original image
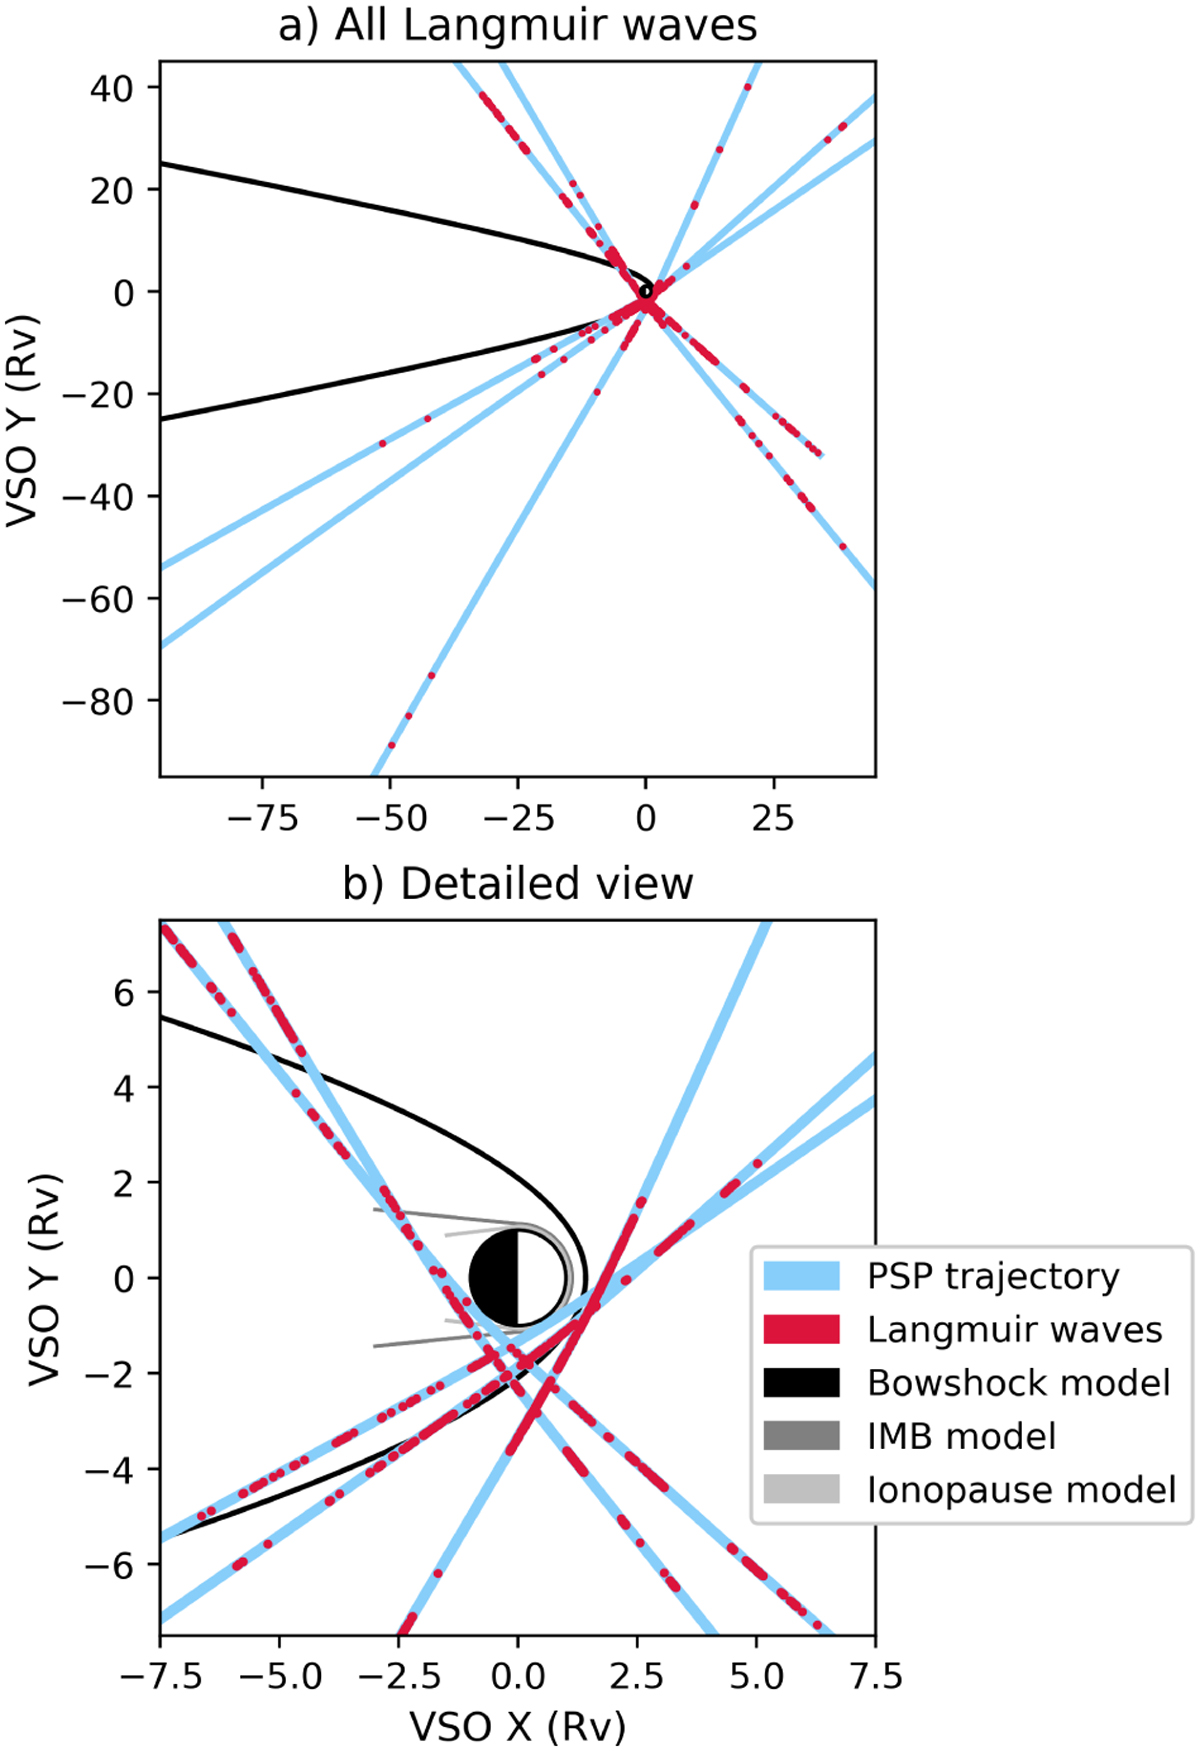
Locations of Langmuir waves that were identified during the PSP VGAs. The PSP trajectories are all shown in light blue and the location of PSP is highlighted in red at times that Langmuir waves were identified. Subplot a shows the locations of all Langmuir waves that were identified in near-Venus space, while subplot b details the location of the waves nearest to the planet. Both subplots are in the XYVSO plane and include the Martinecz et al. (2009) bow shock model for reference. Subplot b additionally includes the models for the induced magnetosphere boundary (1MB) and ionopause from Martinecz et al. (2009).
Current usage metrics show cumulative count of Article Views (full-text article views including HTML views, PDF and ePub downloads, according to the available data) and Abstracts Views on Vision4Press platform.
Data correspond to usage on the plateform after 2015. The current usage metrics is available 48-96 hours after online publication and is updated daily on week days.
Initial download of the metrics may take a while.