Fig. B.2
Download original image
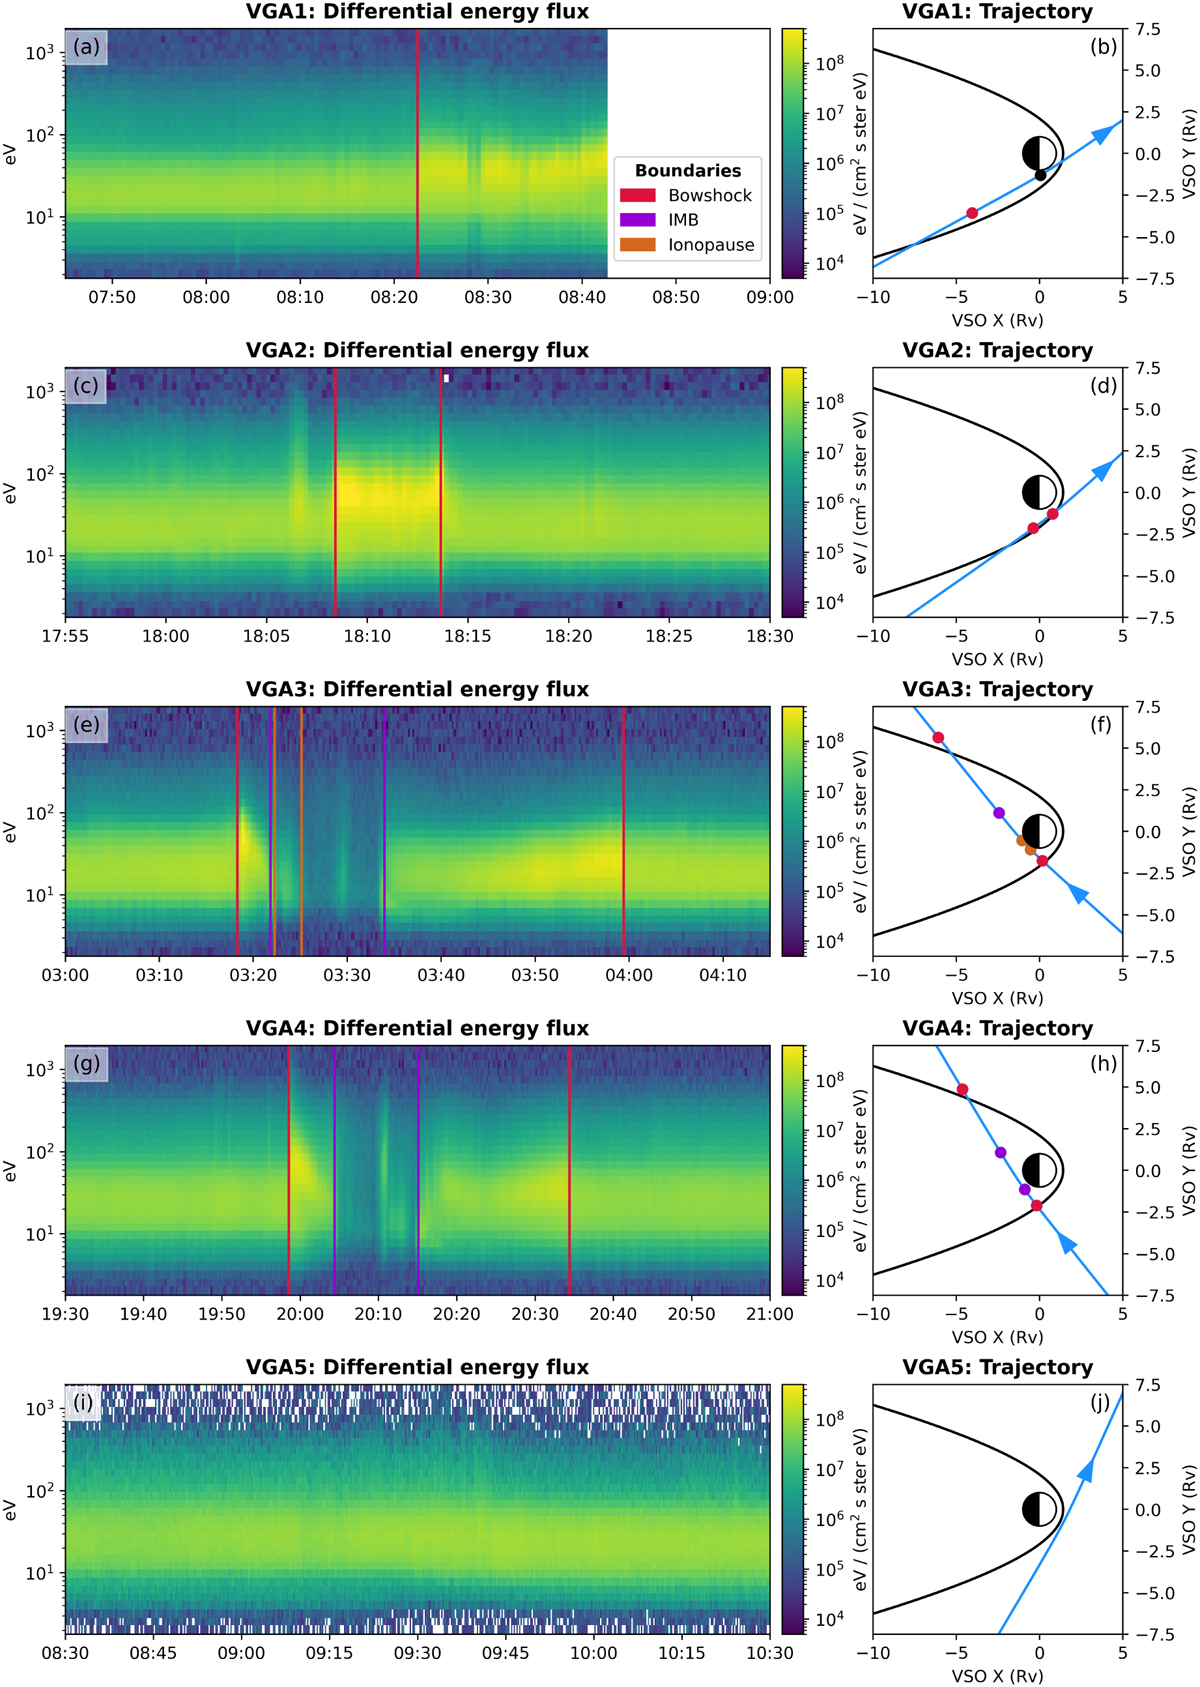
Overview of the first five PSP VGAs; analogous to Figure 1 in the main text but with the left column showing differential electron energy flux. The same colorscale is used for each subplot in the left column. The right column again shows PSP’s trajectory (blue) in the VSO XY plane with respect to Venus (Sun to the right) and the Martinecz et al. (2009) bow shock model (black). The best estimate times of boundary crossings are highlighted in the left column with vertical lines, and dots in the right column show PSP’s location at these times; red lines and dots correspond to bow shock crossings, purple to IMB crossings, and orange shows ionopause crossings. The black dot in subplot b shows PSP’s location when the instruments turned off.
Current usage metrics show cumulative count of Article Views (full-text article views including HTML views, PDF and ePub downloads, according to the available data) and Abstracts Views on Vision4Press platform.
Data correspond to usage on the plateform after 2015. The current usage metrics is available 48-96 hours after online publication and is updated daily on week days.
Initial download of the metrics may take a while.