Fig. B.1
Download original image
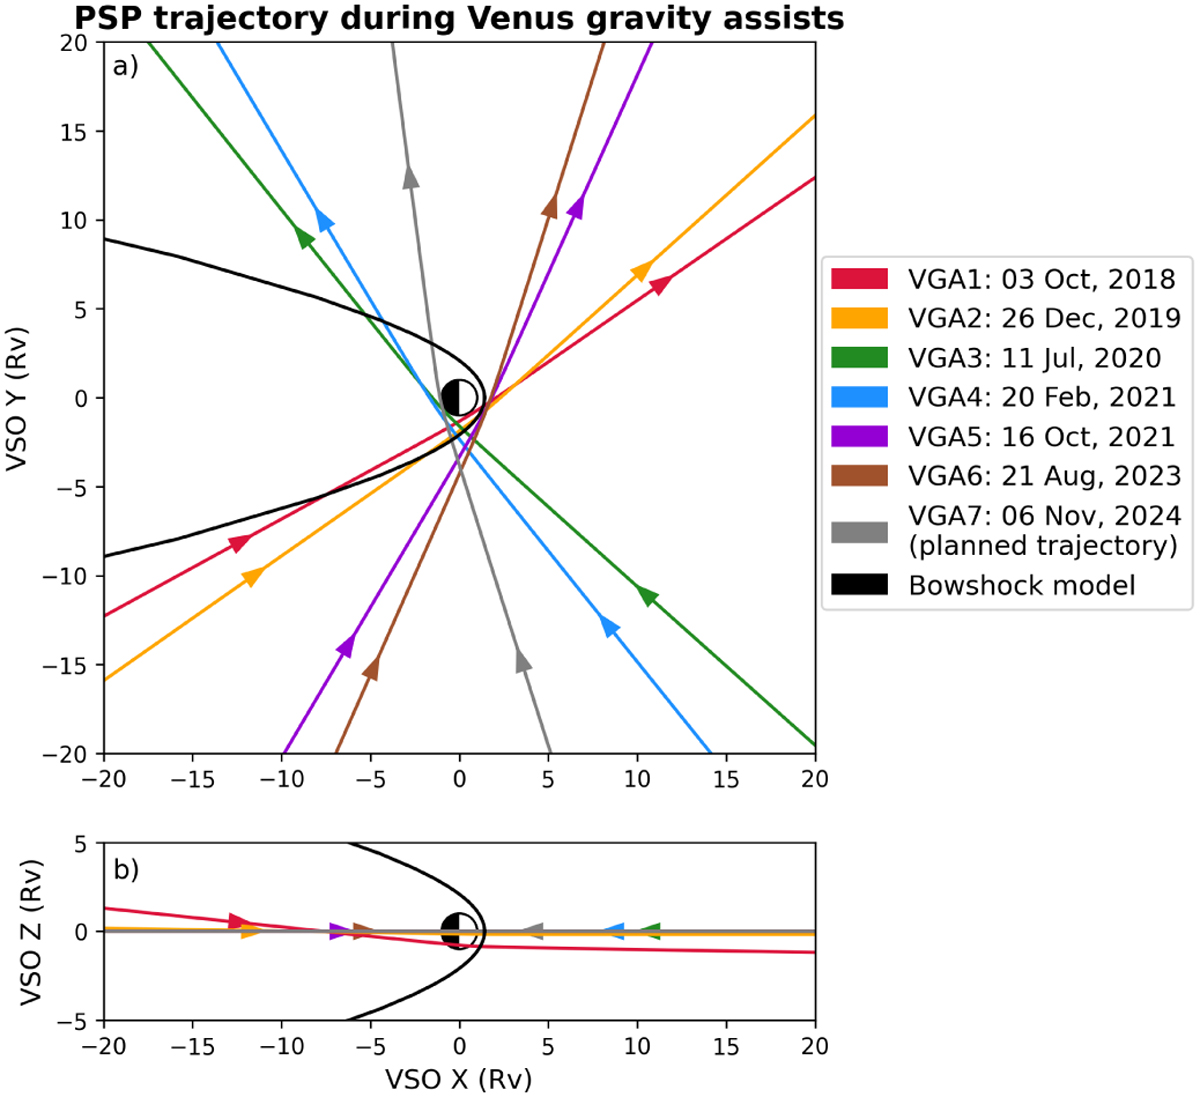
Overview of the Parker Solar Probe trajectories during the Venus gravity assists in the VSO coordinate frame. Subplot a shows the trajectories in the VSO XY plane and subplot b shows these in the VSO XZ plane; the Sun is to the right in both subplots and the black line represents the conic bow shock model from Martinecz et al. (2009).
Current usage metrics show cumulative count of Article Views (full-text article views including HTML views, PDF and ePub downloads, according to the available data) and Abstracts Views on Vision4Press platform.
Data correspond to usage on the plateform after 2015. The current usage metrics is available 48-96 hours after online publication and is updated daily on week days.
Initial download of the metrics may take a while.