Fig. 10
Download original image
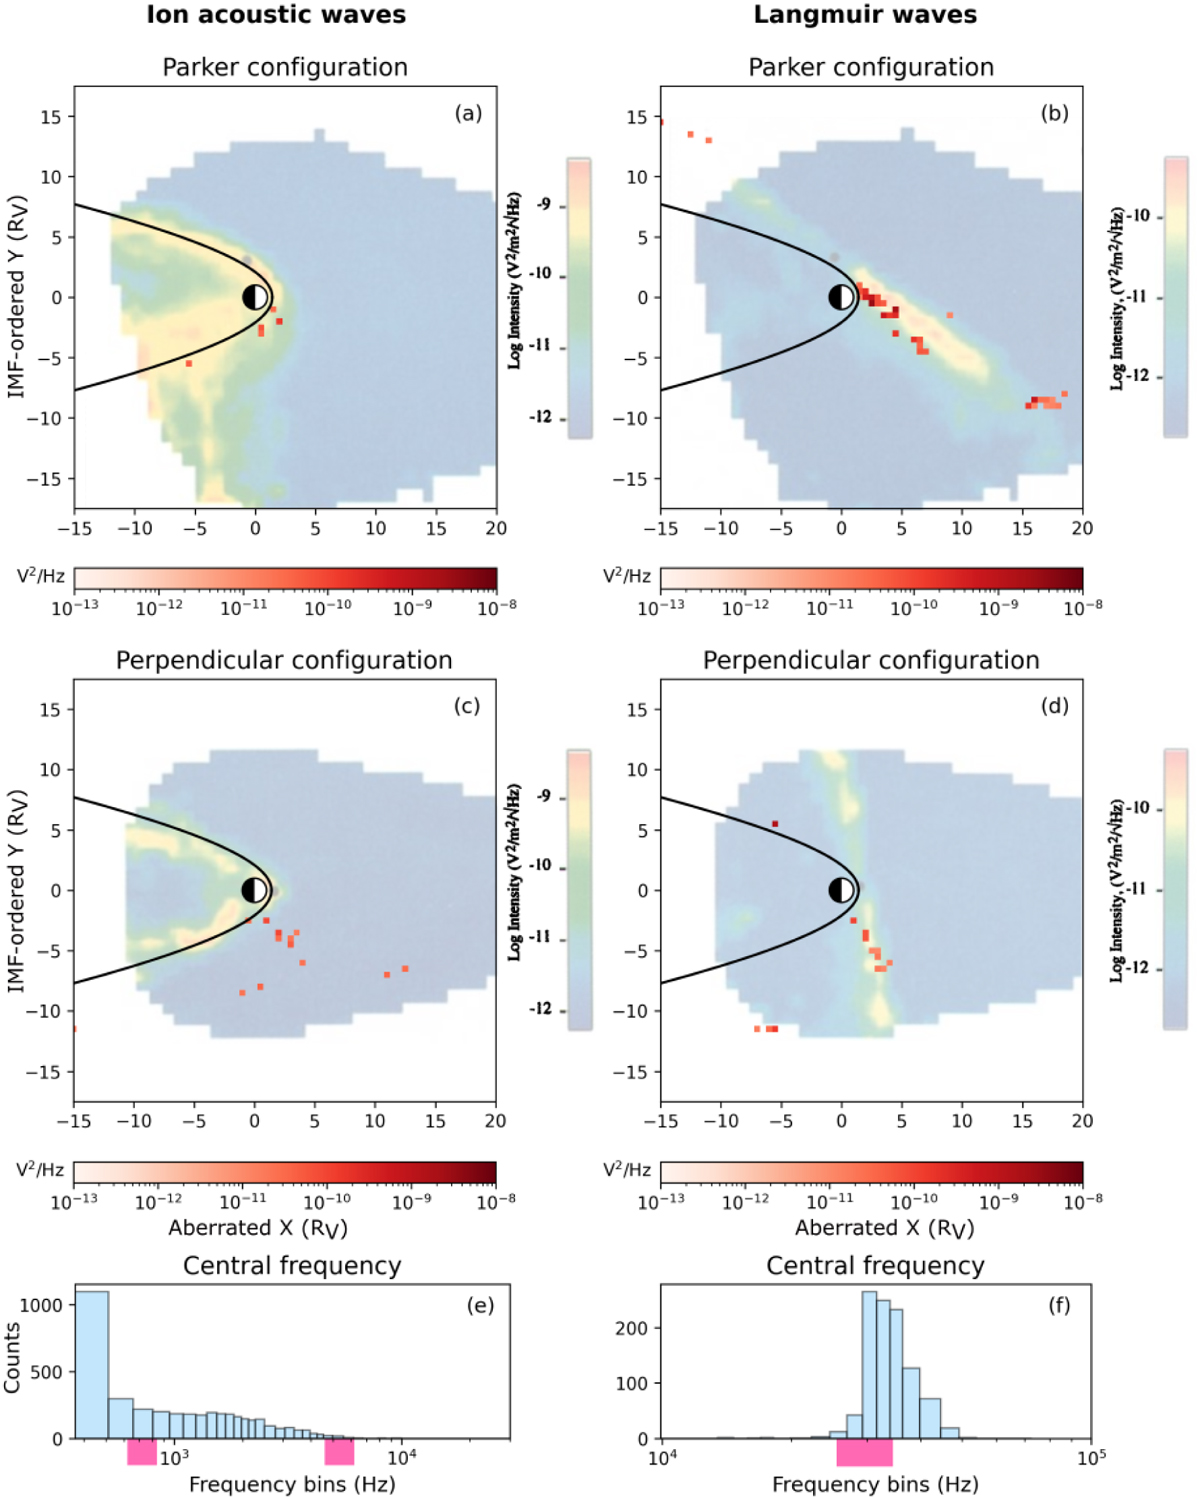
Subplot a shows the maximum power of the ion acoustic waves detected by PSP (red colorscale) when the IMF was in the Parker configuration, overlaid on Figure 2a of Crawford et al. (1998) (muted rainbow colorscale). Subplot b shows the same but for the Langmuir waves detected by PSP overlaid on Figure 1a of Crawford et al. (1998). Subplots c and d show the ion acoustic and Langmuir waves respectively when the solar wind was in a perpendicular configuration, overlaid on Figures 5a and 4a of Crawford et al. (1998) respectively. The bow shock calculated from the Martinecz et al. (2009) model is shown in black in subplots a–d. Subplots e and f show the central frequency of all the ion acoustic and Langmuir waves detected by PSP respectively. The pink bars on the x-axis of subplots e and f show the frequency coverage of channels of the PVO OEFD instrument.
Current usage metrics show cumulative count of Article Views (full-text article views including HTML views, PDF and ePub downloads, according to the available data) and Abstracts Views on Vision4Press platform.
Data correspond to usage on the plateform after 2015. The current usage metrics is available 48-96 hours after online publication and is updated daily on week days.
Initial download of the metrics may take a while.