Fig. 5.
Download original image
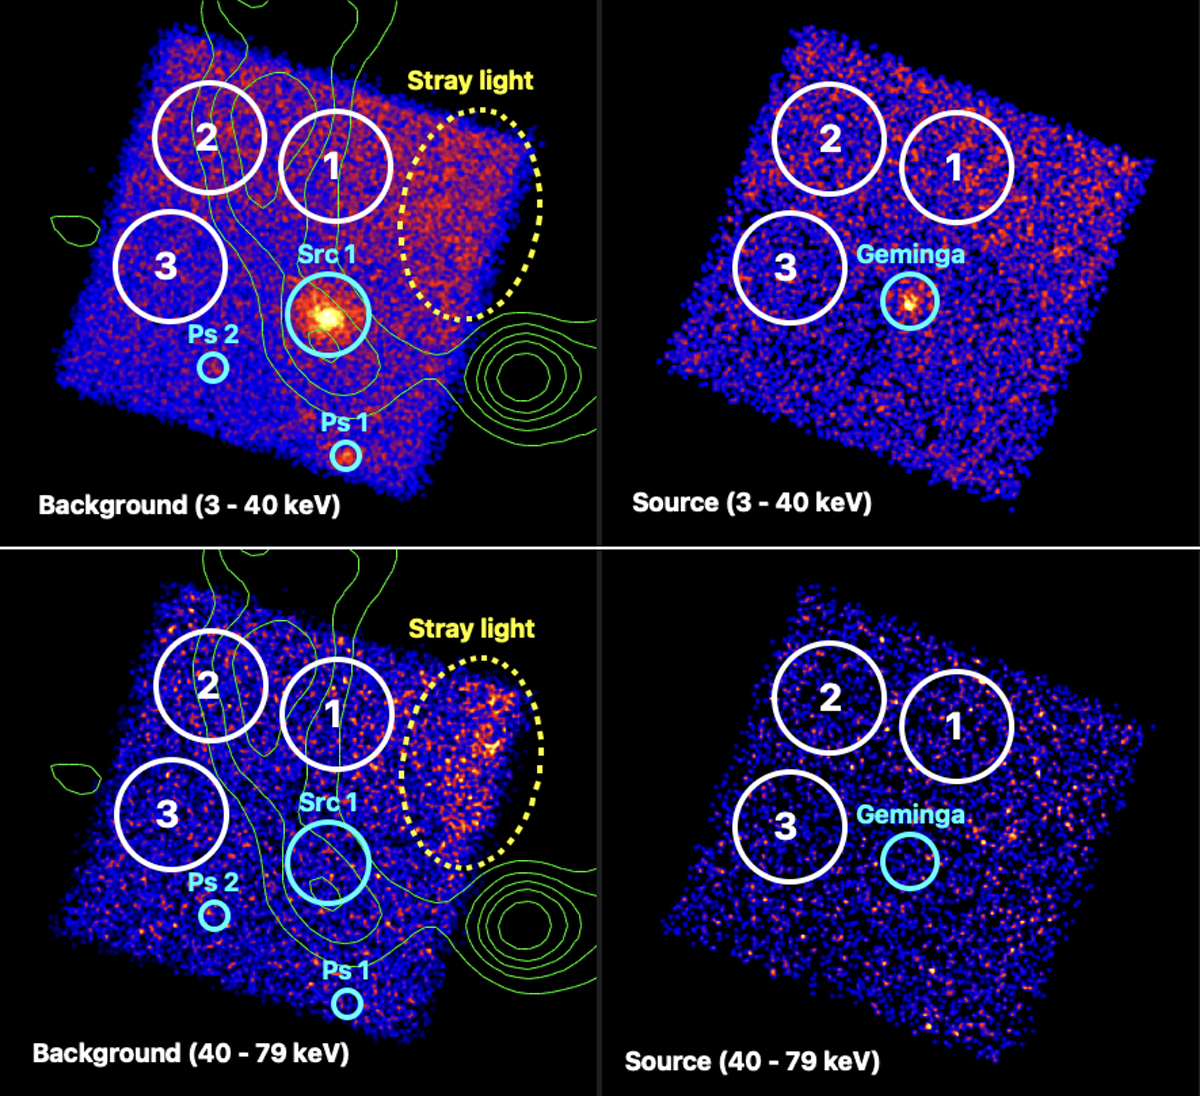
Background and source counts map in two energy bands. The images were scaled for better visibility. Detected sources (Src 1, Ps 1 and 2, Geminga) are marked with cyan circles. Local stray light background only present in the background observation is marked with yellow dashed ellipse. VLA 74 MHz contour of IC 443 is overlaid in green (The VLA Low-Frequency Sky Survey Redux (VLSSr) Postage Stamp Server, https://www.cv.nrao.edu/vlss/VLSSpostage.shtml). Our regions of interest (region 1–3) are marked with white circles.
Current usage metrics show cumulative count of Article Views (full-text article views including HTML views, PDF and ePub downloads, according to the available data) and Abstracts Views on Vision4Press platform.
Data correspond to usage on the plateform after 2015. The current usage metrics is available 48-96 hours after online publication and is updated daily on week days.
Initial download of the metrics may take a while.