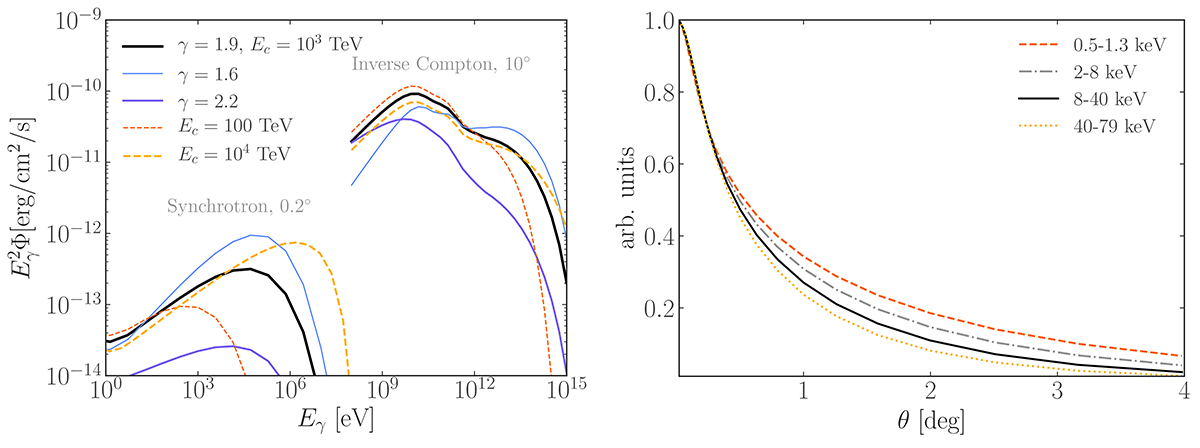
Fig. 3.
Download original image
Effect of the spectral model and energy bin. Left panel: SEDs of the Geminga pulsar halo emission for different values of the spectral parameters γ and Ec of the electron’s source term Q(E)∝E−γexp( − E/Ec). When not specified, curves are obtained for the benchmark value of γ = 1.9 and Ec = 103 TeV. Angular integration as in Fig. 1. Right panel: Surface brightness of the Geminga’s pulsar halo obtained by integrating in different energy intervals, corresponding to the XMM-Newton (0.5−8 keV) data analysis, and to the NuSTAR ones. All curves are rescaled to their value at θ = 0.
Current usage metrics show cumulative count of Article Views (full-text article views including HTML views, PDF and ePub downloads, according to the available data) and Abstracts Views on Vision4Press platform.
Data correspond to usage on the plateform after 2015. The current usage metrics is available 48-96 hours after online publication and is updated daily on week days.
Initial download of the metrics may take a while.