Fig. A.1.
Download original image
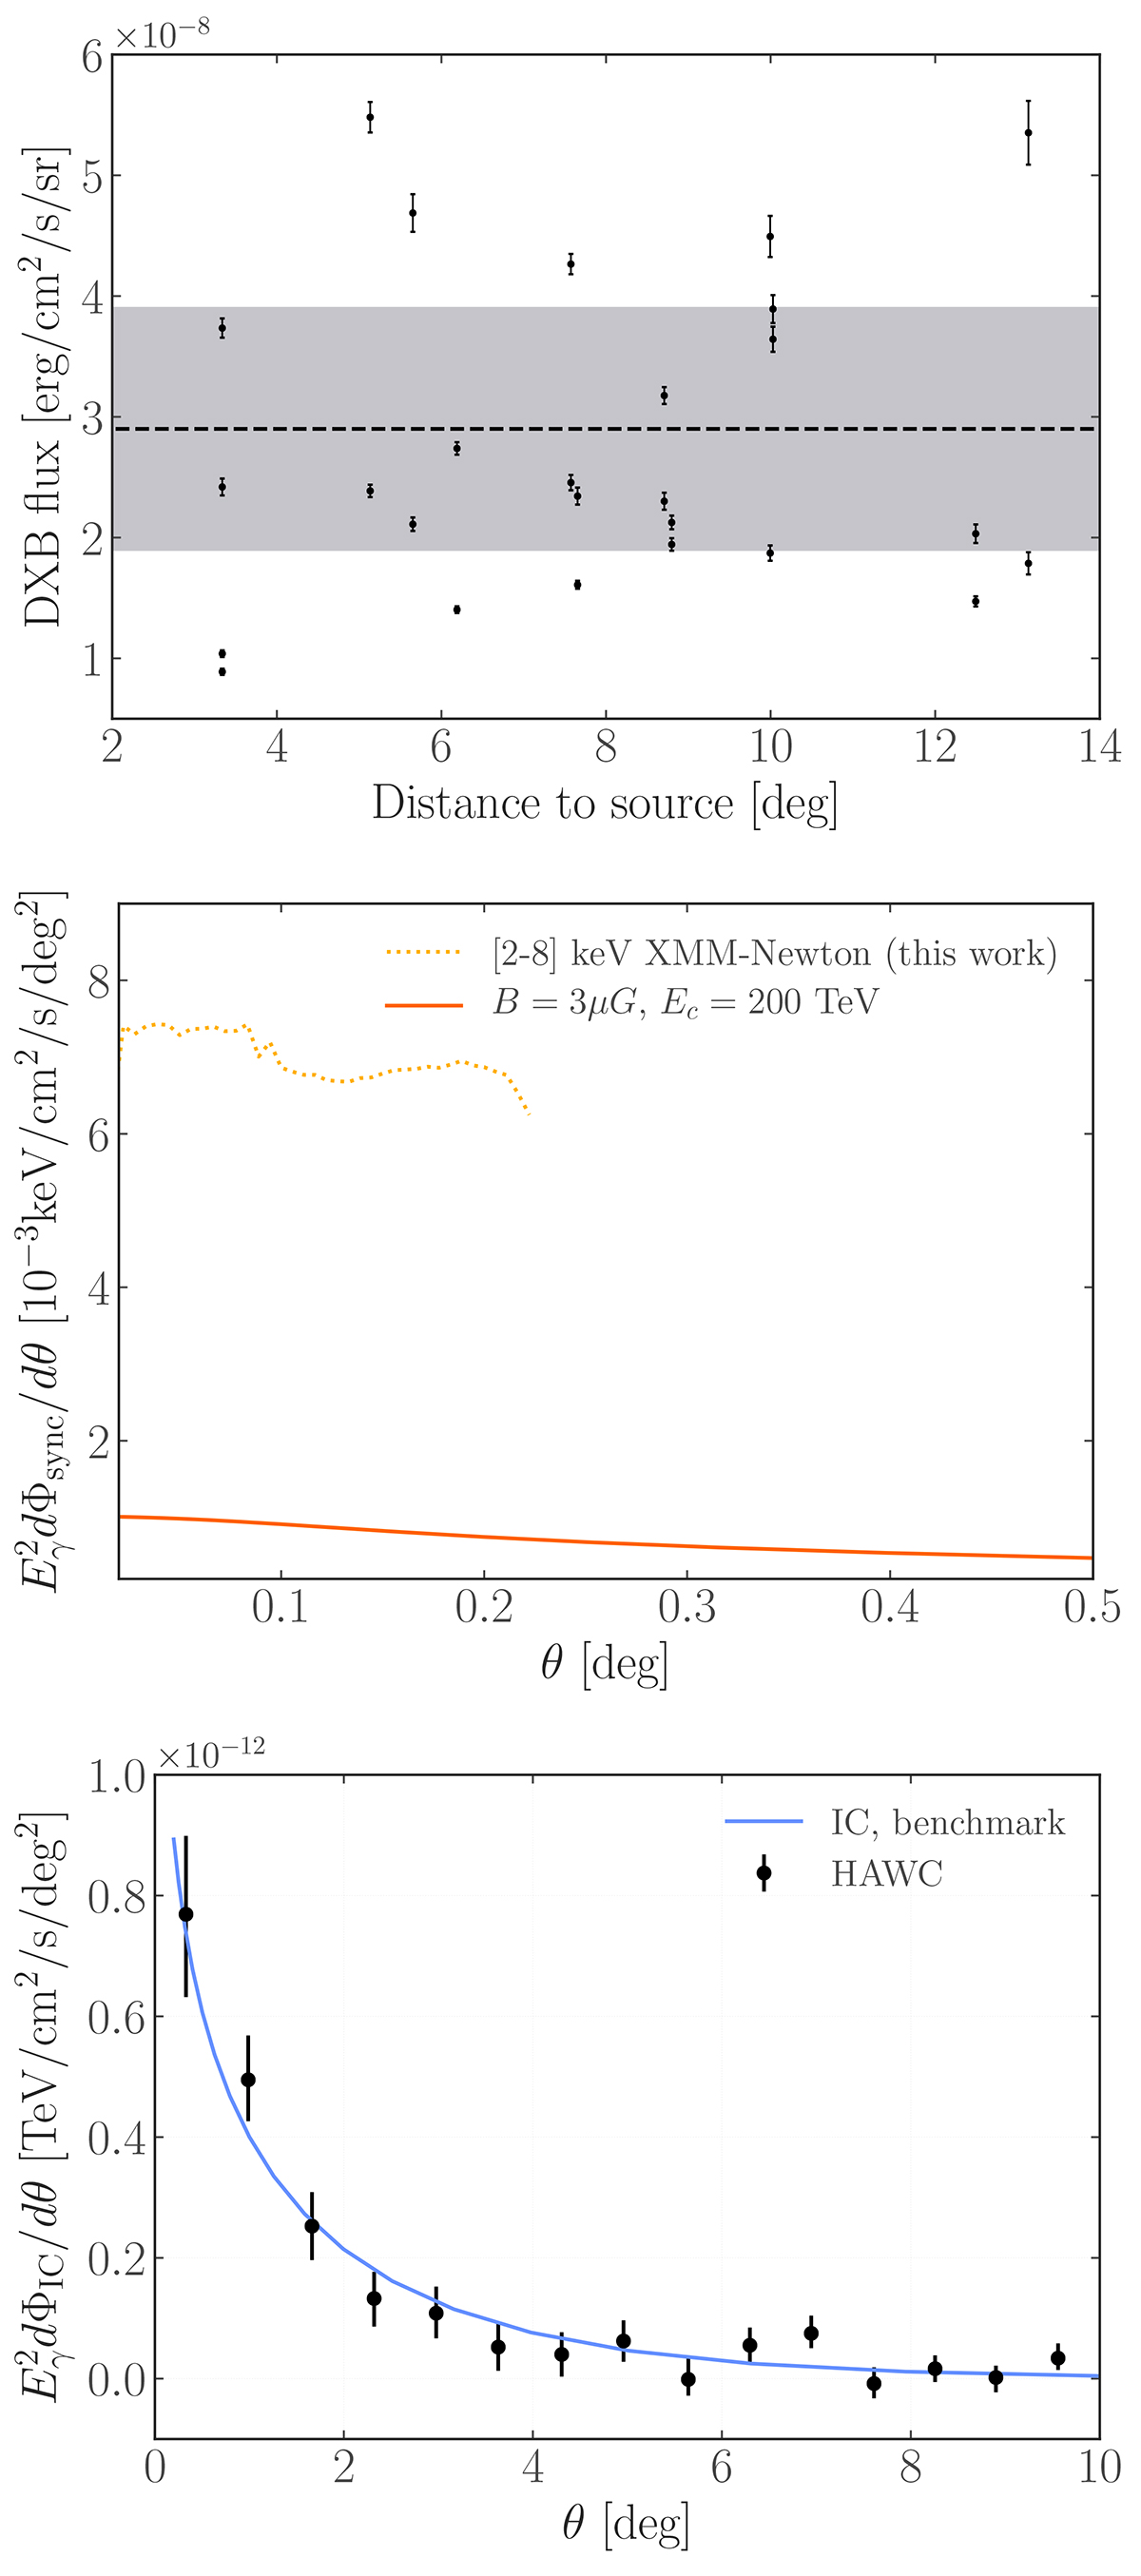
Additional figures. Upper panel: The measured DXB fluxes from multiple extragalactic observations with XMM-Newton. The vertical bars represent the statistical error in the measurement of each observation. The grey band shows the averaged DXB flux and uncertainty, and the horizontal dashed line the average DXB flux. Middle panel: Comparison of Geminga model with XMM-Newton upper limits on the angular profile for the high energy bin 2-8 keV. Lower panel: surface brightness profile of inverse Compton emission from Geminga’s pulsar halo for our benchmark model, as compare with HAWC data from Abeysekara et al. (2017).
Current usage metrics show cumulative count of Article Views (full-text article views including HTML views, PDF and ePub downloads, according to the available data) and Abstracts Views on Vision4Press platform.
Data correspond to usage on the plateform after 2015. The current usage metrics is available 48-96 hours after online publication and is updated daily on week days.
Initial download of the metrics may take a while.