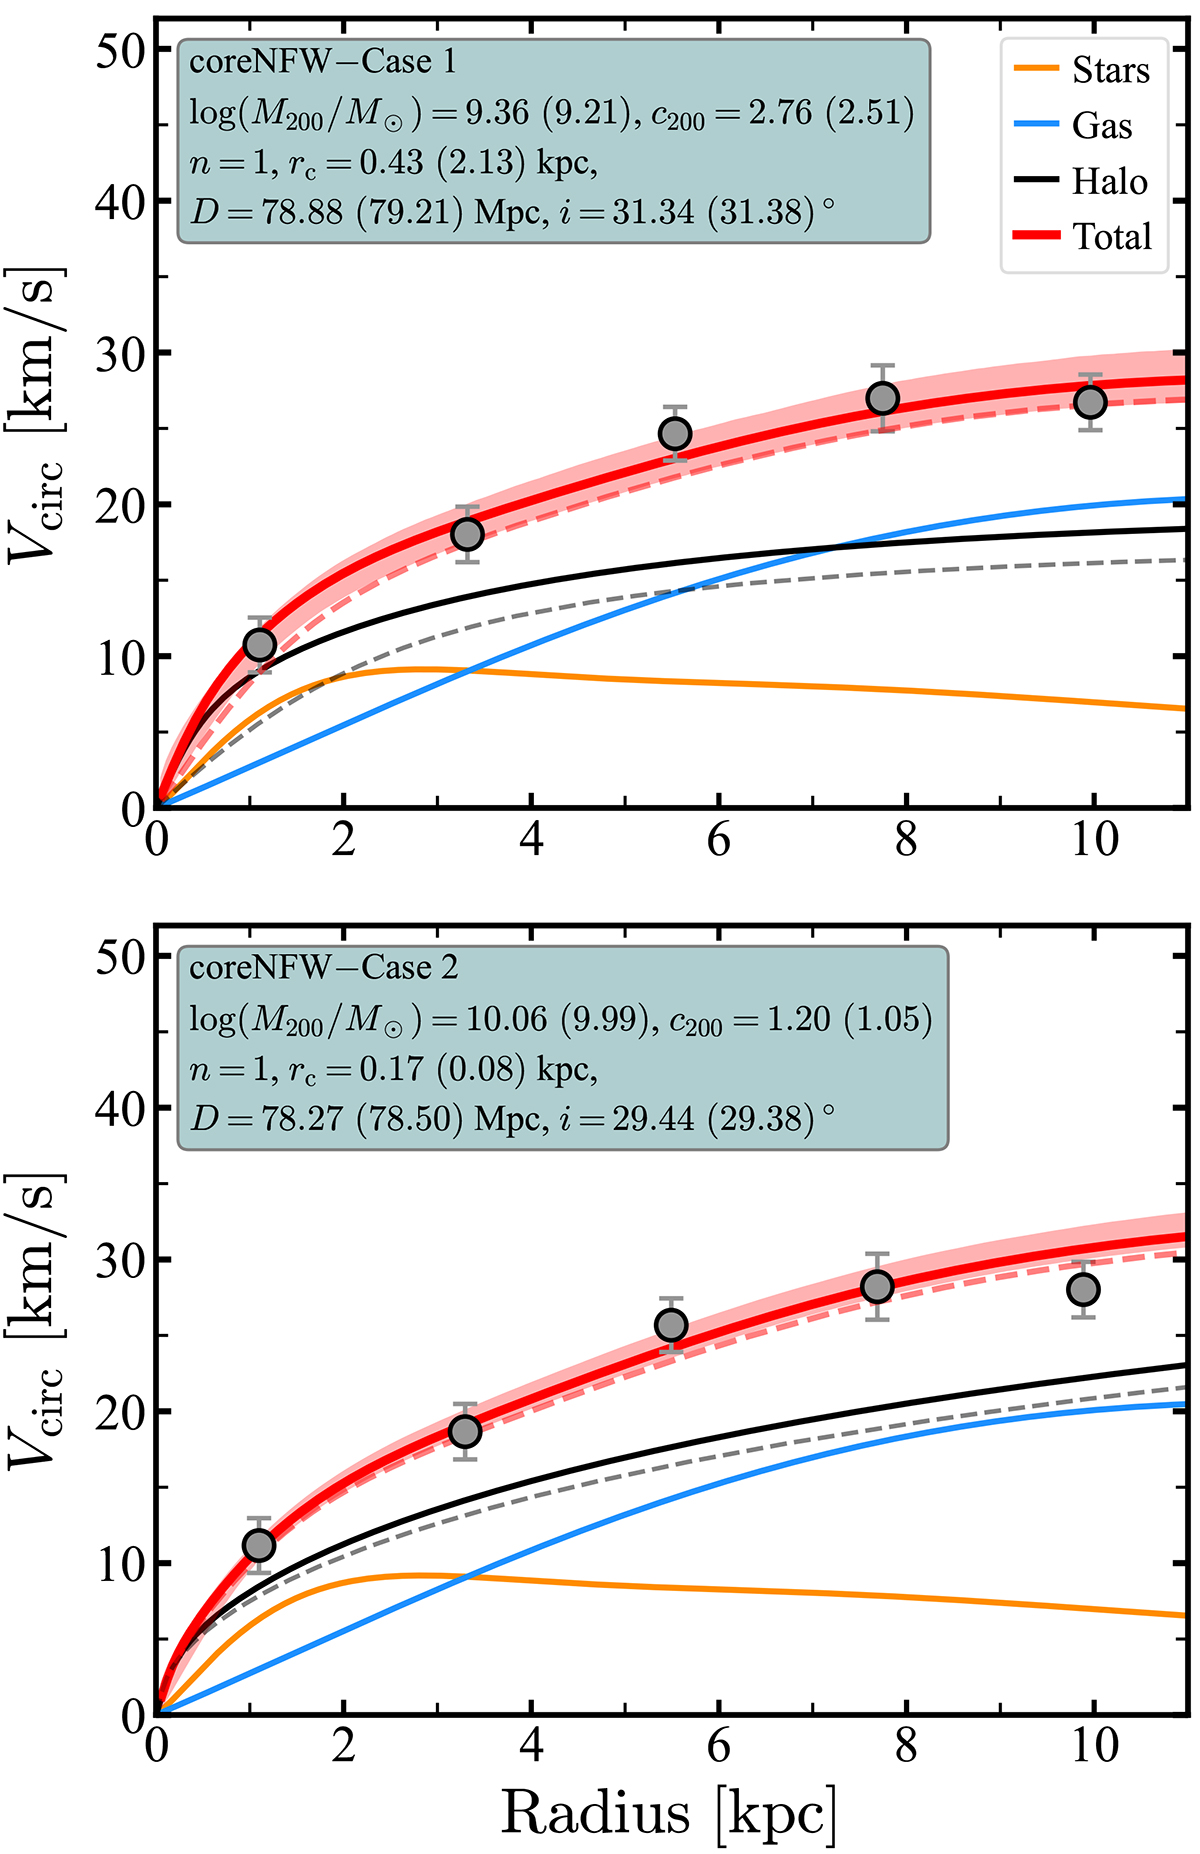
Fig. 9.
Download original image
Mass models within the CDM framework. The top panel shows the fit for Case 1 when M200 can be as low as 107 M⊙, which results in a baryon fraction higher than the cosmological average. The bottom corresponds to Case 2, when M200 ensures a baryon fraction lower or equal to the cosmological baryon fraction. The median parameters of the best-fitting distributions are listed on each panel, together with the maximum-likelihood values (in parentheses). In both panels, the orange, blue, and black curves represent the contribution to the total circular speed (red) from the stars, gas, and dark matter halo, respectively. The red band represents the 16th and 84th percentiles of our posteriors at the best-fitting distance and inclination. The best-fitting distance and inclination are slightly different between the two panels. The additional black and red dashed curves correspond to the maximum-likelihood mass model.
Current usage metrics show cumulative count of Article Views (full-text article views including HTML views, PDF and ePub downloads, according to the available data) and Abstracts Views on Vision4Press platform.
Data correspond to usage on the plateform after 2015. The current usage metrics is available 48-96 hours after online publication and is updated daily on week days.
Initial download of the metrics may take a while.