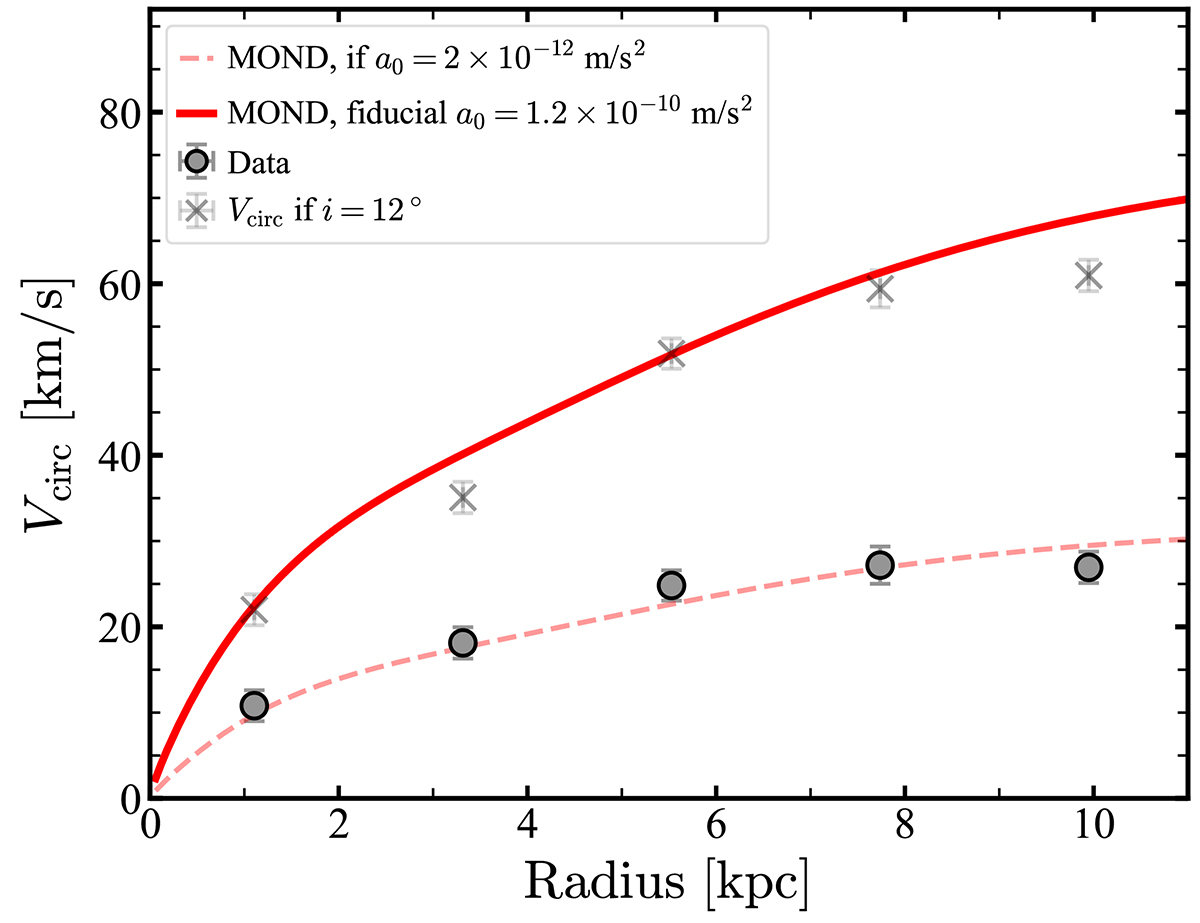
Fig. 8.
Download original image
Comparison between the circular speed of AGC 114905 (solid grey symbols) against the MOND expectations (red solid curve). There is a marked disagreement between the data and the MOND prediction. The transparent grey symbols show a hypothetical rotation curve if the inclination correction is increased to match the MOND prediction; the needed inclination (i ≈ 12°) is inconsistent with the optical and gas morphologies. The transparent red dashed curve shows a MOND prediction if a0 is 60 times smaller than the accepted value.
Current usage metrics show cumulative count of Article Views (full-text article views including HTML views, PDF and ePub downloads, according to the available data) and Abstracts Views on Vision4Press platform.
Data correspond to usage on the plateform after 2015. The current usage metrics is available 48-96 hours after online publication and is updated daily on week days.
Initial download of the metrics may take a while.