Fig. 6.
Download original image
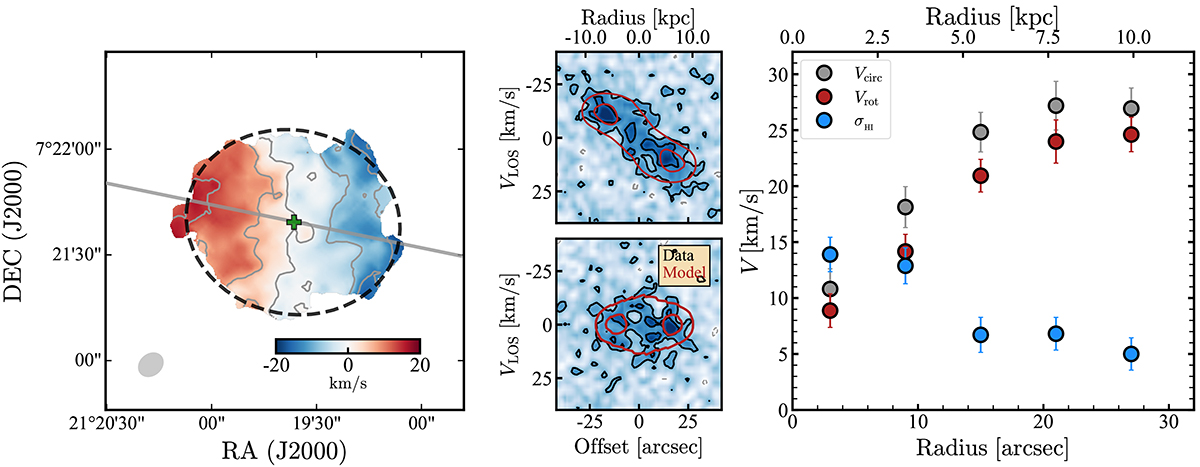
Gas kinematics of AGC 114905. Left: H I velocity field. The grey line and filled ellipse show the position angle and beam of the observations, respectively. The black dashed line shows an ellipse with the global position angle and inclination. The grey curves in the velocity field are iso-velocity contours (Vsys is in zero). Middle: major-axis (top) and minor-axis (bottom) position-velocity diagrams. Black (grey for negative values) and red contours represent the data and best-fitting kinematic model, respectively. Contours are at −2, 2, 4× the rms noise of the slice. Right: circular speed profile (grey), rotation velocity (red), and gas velocity dispersion (blue) of AGC 114905. To convert from Vrot to Vcirc, we apply the asymmetric drift correction (see text for details). The kinematic model assumes an inclination of 31°.
Current usage metrics show cumulative count of Article Views (full-text article views including HTML views, PDF and ePub downloads, according to the available data) and Abstracts Views on Vision4Press platform.
Data correspond to usage on the plateform after 2015. The current usage metrics is available 48-96 hours after online publication and is updated daily on week days.
Initial download of the metrics may take a while.