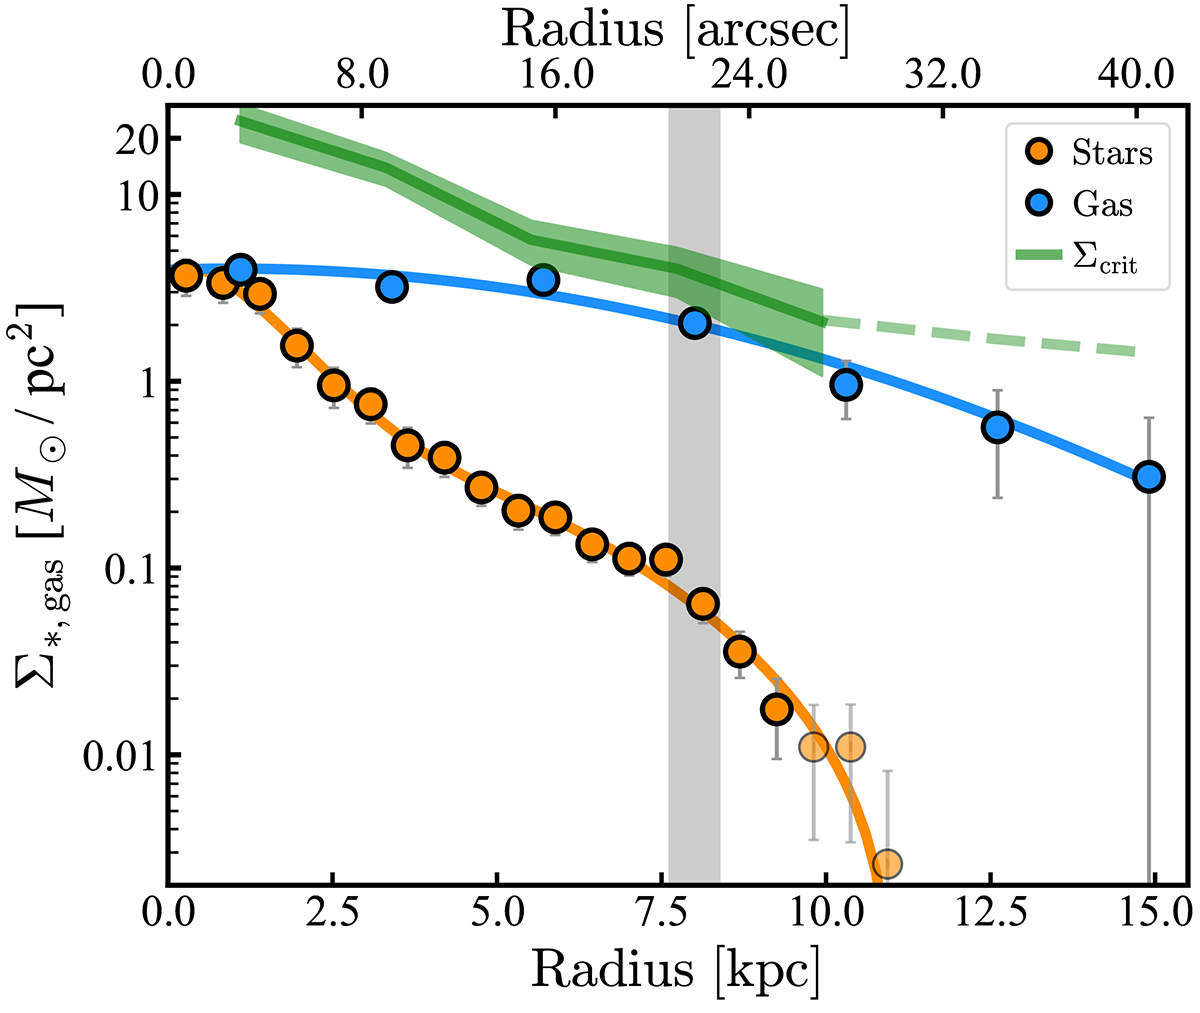
Fig. 5.
Download original image
Stellar (orange) and gas (blue) mass surface density profiles. The stellar profile shows a clear truncation at about 7.5 kpc (∼20 arcsec) (grey band), which coincides with the radius at which the gas profile also decays more strongly. We marked with higher transparency the stellar mass density data points derived from those values in the colour and surface brightness profiles with uncertainties larger than 0.1 mag/arcsec2 (see Figure 4). The gas profile lies below Σcrit (green), a theoretical threshold to trigger star formation (see Sect. 6 for details). The dashed part of Σcrit was extrapolated from the data, assuming that the rotation curve and velocity dispersion profiles stay flat after the outermost observed radius (see Sect. 4). The blue and orange curves represent functional forms fitted to the surface densities and are used during our mass modelling (see Sect. 5).
Current usage metrics show cumulative count of Article Views (full-text article views including HTML views, PDF and ePub downloads, according to the available data) and Abstracts Views on Vision4Press platform.
Data correspond to usage on the plateform after 2015. The current usage metrics is available 48-96 hours after online publication and is updated daily on week days.
Initial download of the metrics may take a while.