Fig. 2.
Download original image
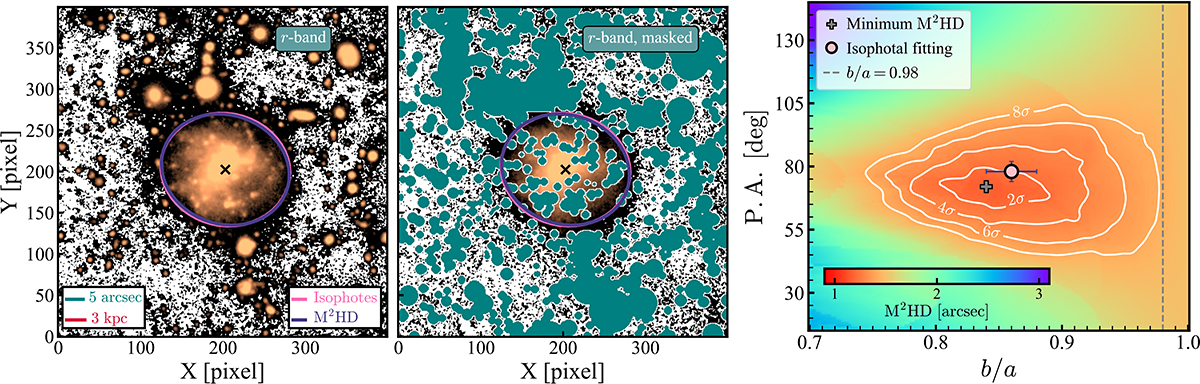
Constraining the axis ratio and position angle of the stellar disc of AGC 114905. Left and middle show the r-band stellar emission without and with our mask, respectively. Both panels include two ellipses, one obtained through isophotal fitting (pink) and one through the M2HD method (purple). The black crosses represent the centre of the galaxy. Right: M2HD map. The grey marker highlights the minimum of the map, and the white contours represent 2, 4, 6, and 8 standard deviations. The parameters obtained through isophotal fitting (pink marker) are shown to be in 2σ agreement. Very high axis ratios (i.e. nearly face-on inclinations) are in significant tension with the data.
Current usage metrics show cumulative count of Article Views (full-text article views including HTML views, PDF and ePub downloads, according to the available data) and Abstracts Views on Vision4Press platform.
Data correspond to usage on the plateform after 2015. The current usage metrics is available 48-96 hours after online publication and is updated daily on week days.
Initial download of the metrics may take a while.