Fig. 12.
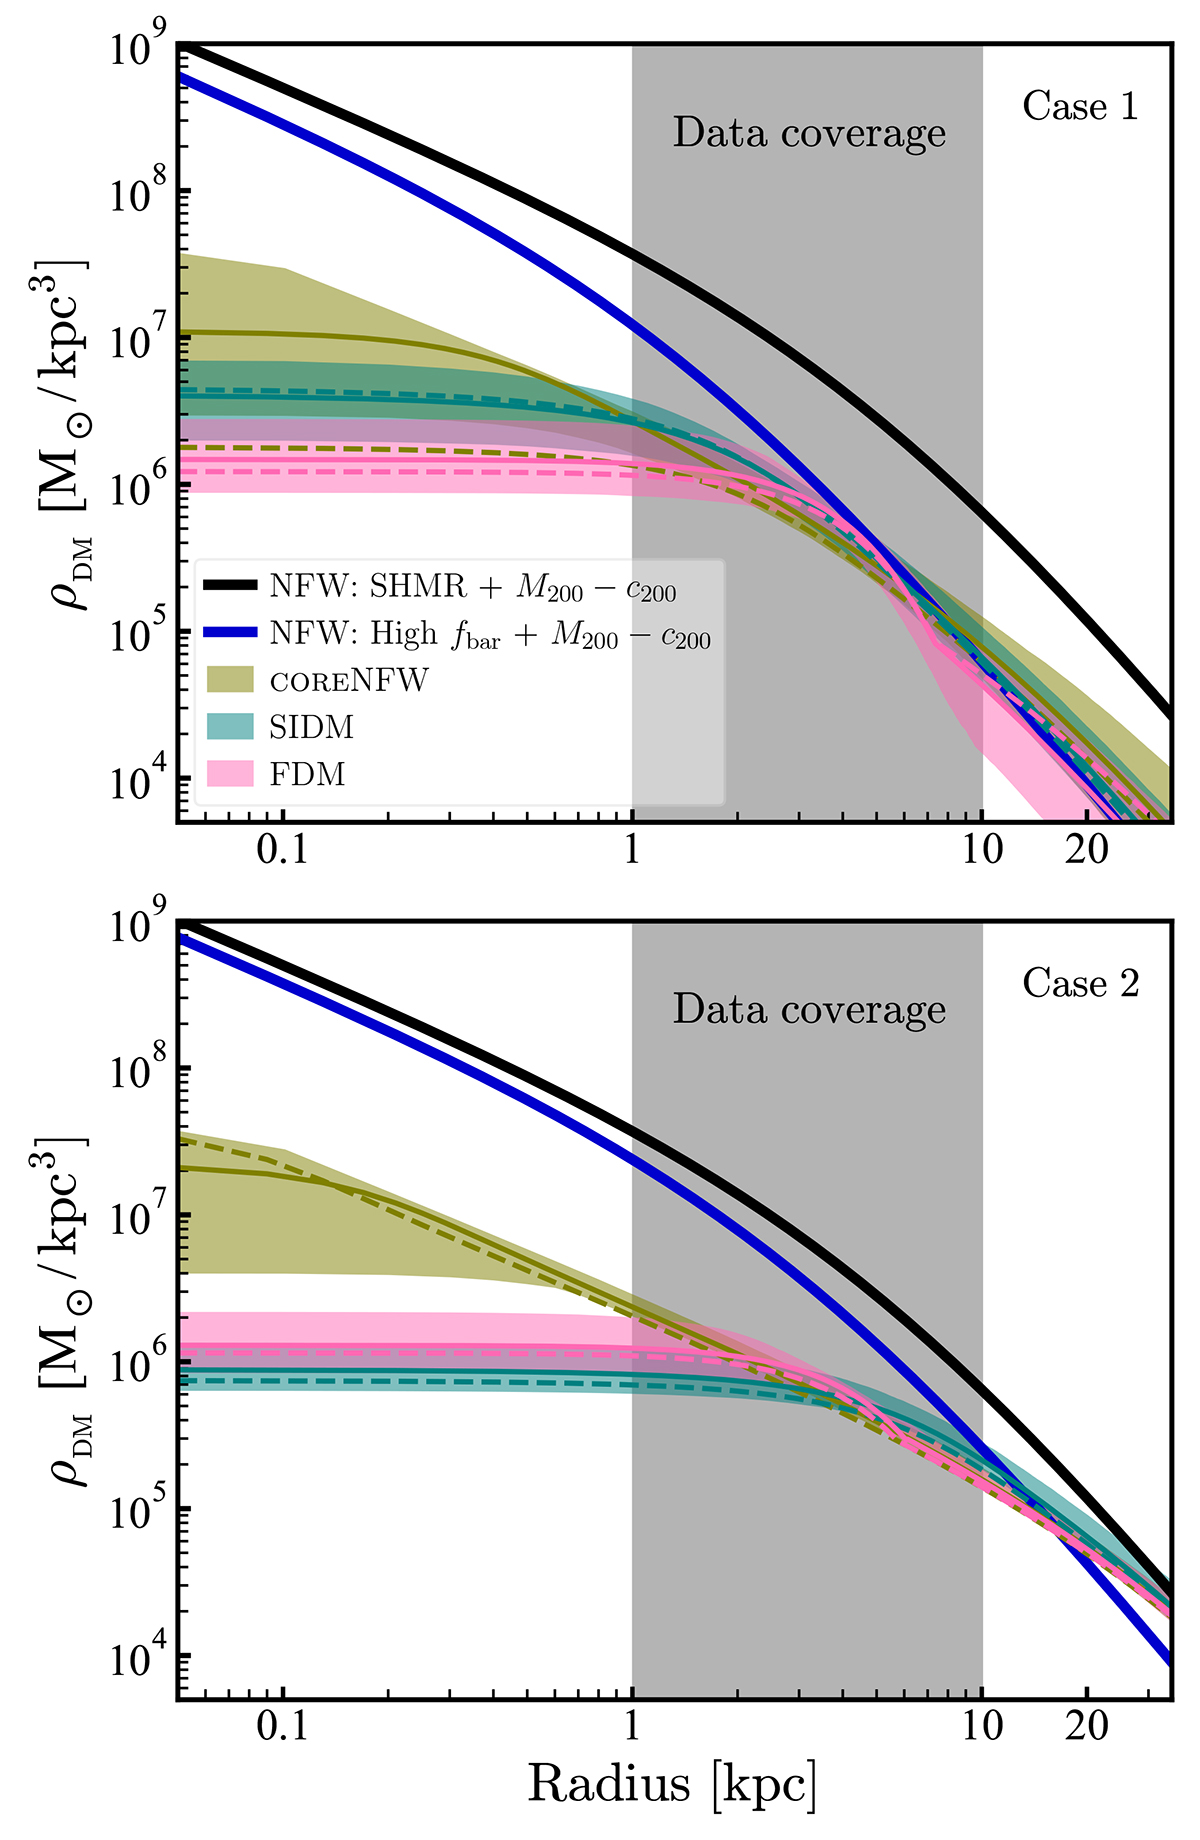
Download original image
Dark matter density profiles for the dark matter models studied in Sects. 5.2–5.4. The top (bottom) shows the Case 1 (Case 2) mass models. In each panel, two reference haloes are plotted. One halo (black dashed line, same for both panels) having a mass expected from an SHMR and a concentration from the c200 − M200 relation. The other halo (blue curves, different among the panels) instead has a halo mass similar to what we measure for Case 1 and Case 2 and a concentration from the c200 − M200 relation. The grey region illustrates the approximate extent of our rotation curve.
Current usage metrics show cumulative count of Article Views (full-text article views including HTML views, PDF and ePub downloads, according to the available data) and Abstracts Views on Vision4Press platform.
Data correspond to usage on the plateform after 2015. The current usage metrics is available 48-96 hours after online publication and is updated daily on week days.
Initial download of the metrics may take a while.